

Multimodality imaging methods for assessing retinoblastoma orthotopic xenograft growth and development
- PMID: 24901248
- PMCID: PMC4047070
- DOI: 10.1371/journal.pone.0099036
Multimodality imaging methods for assessing retinoblastoma orthotopic xenograft growth and development
Abstract
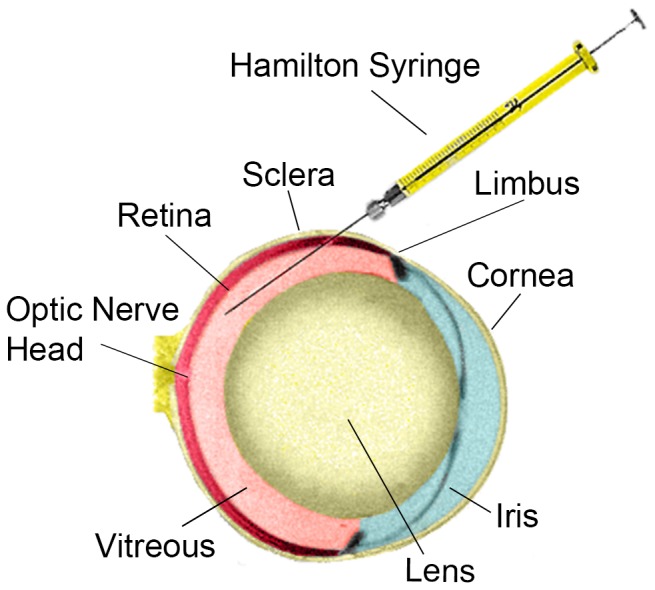
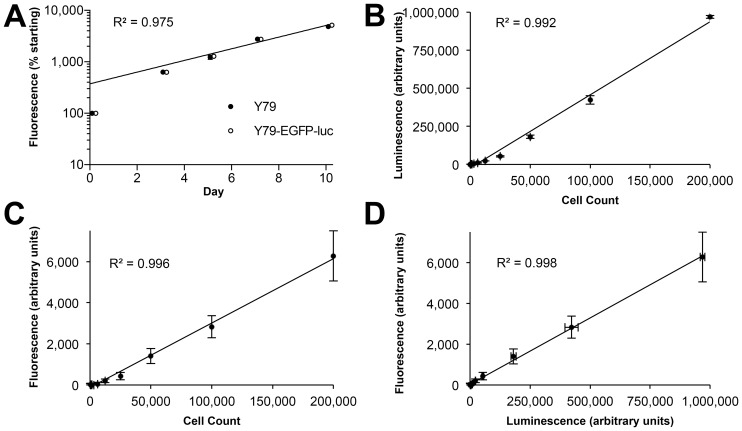
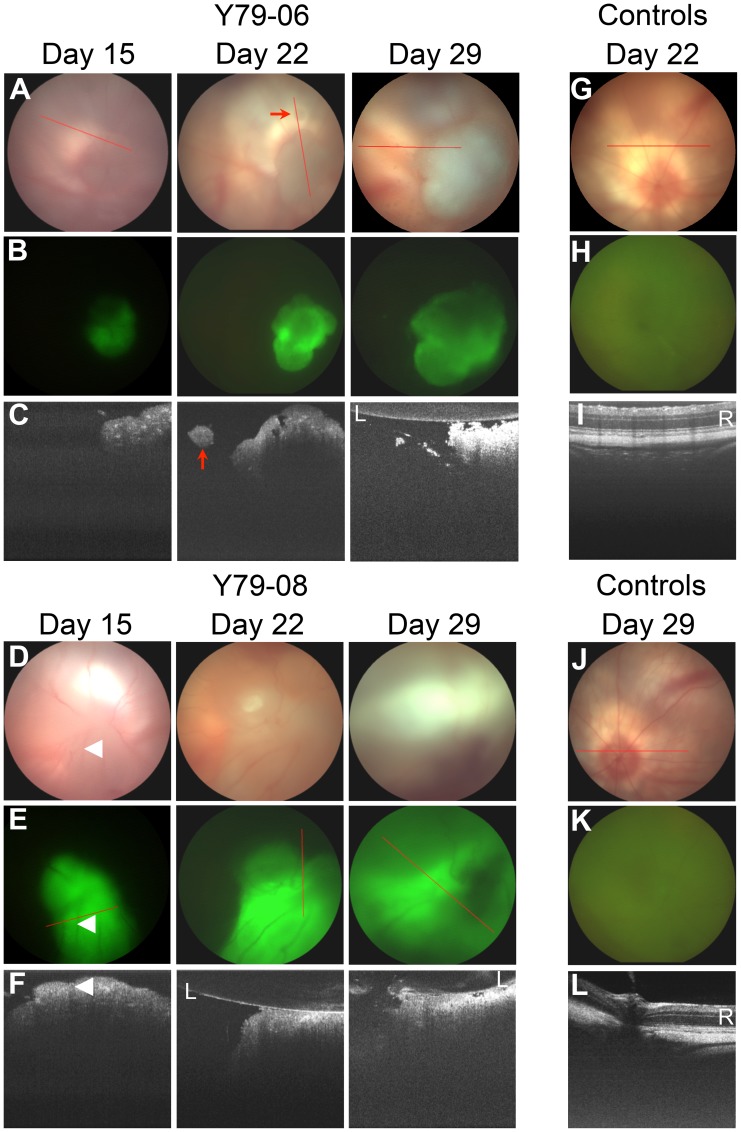
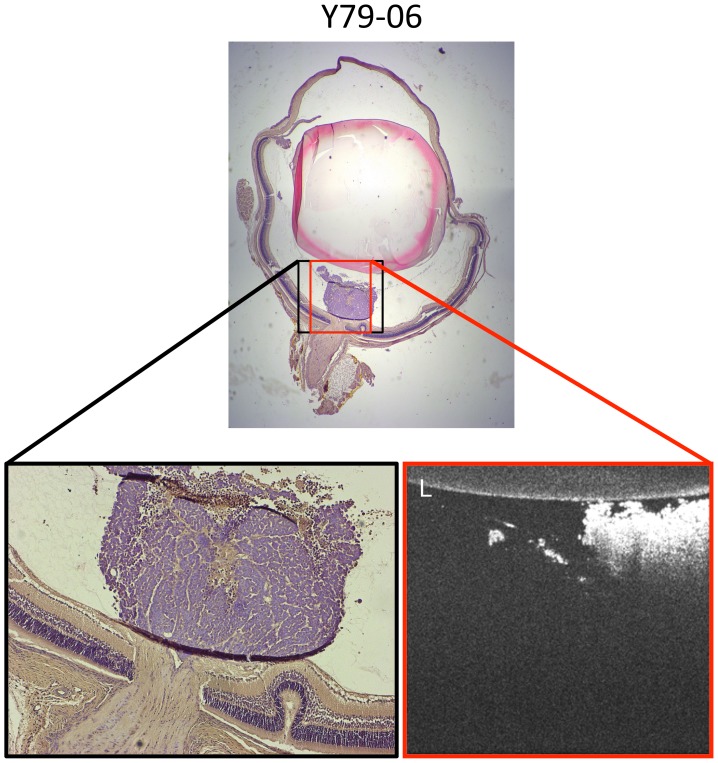
Genomic studies of the pediatric ocular tumor retinoblastoma are paving the way for development of targeted therapies. Robust model systems such as orthotopic xenografts are necessary for testing such therapeutics. One system involves bioluminescence imaging of luciferase-expressing human retinoblastoma cells injected into the vitreous of newborn rat eyes. Although used for several drug studies, the spatial and temporal development of tumors in this model has not been documented. Here, we present a new model to allow analysis of average luciferin flux ([Formula: see text]) through the tumor, a more biologically relevant parameter than peak bioluminescence as traditionally measured. Moreover, we monitored the spatial development of xenografts in the living eye. We engineered Y79 retinoblastoma cells to express a lentivirally-delivered enhanced green fluorescent protein-luciferase fusion protein. In intravitreal xenografts, we assayed bioluminescence and computed [Formula: see text], as well as documented tumor growth by intraocular optical coherence tomography (OCT), brightfield, and fluorescence imaging. In vivo bioluminescence, ex vivo tumor size, and ex vivo fluorescent signal were all highly correlated in orthotopic xenografts. By OCT, xenografts were dense and highly vascularized, with well-defined edges. Small tumors preferentially sat atop the optic nerve head; this morphology was confirmed on histological examination. In vivo, [Formula: see text] in xenografts showed a plateau effect as tumors became bounded by the dimensions of the eye. The combination of [Formula: see text] modeling and in vivo intraocular imaging allows both quantitative and high-resolution, non-invasive spatial analysis of this retinoblastoma model. This technique will be applied to other cell lines and experimental therapeutic trials in the future.
Conflict of interest statement
Figures
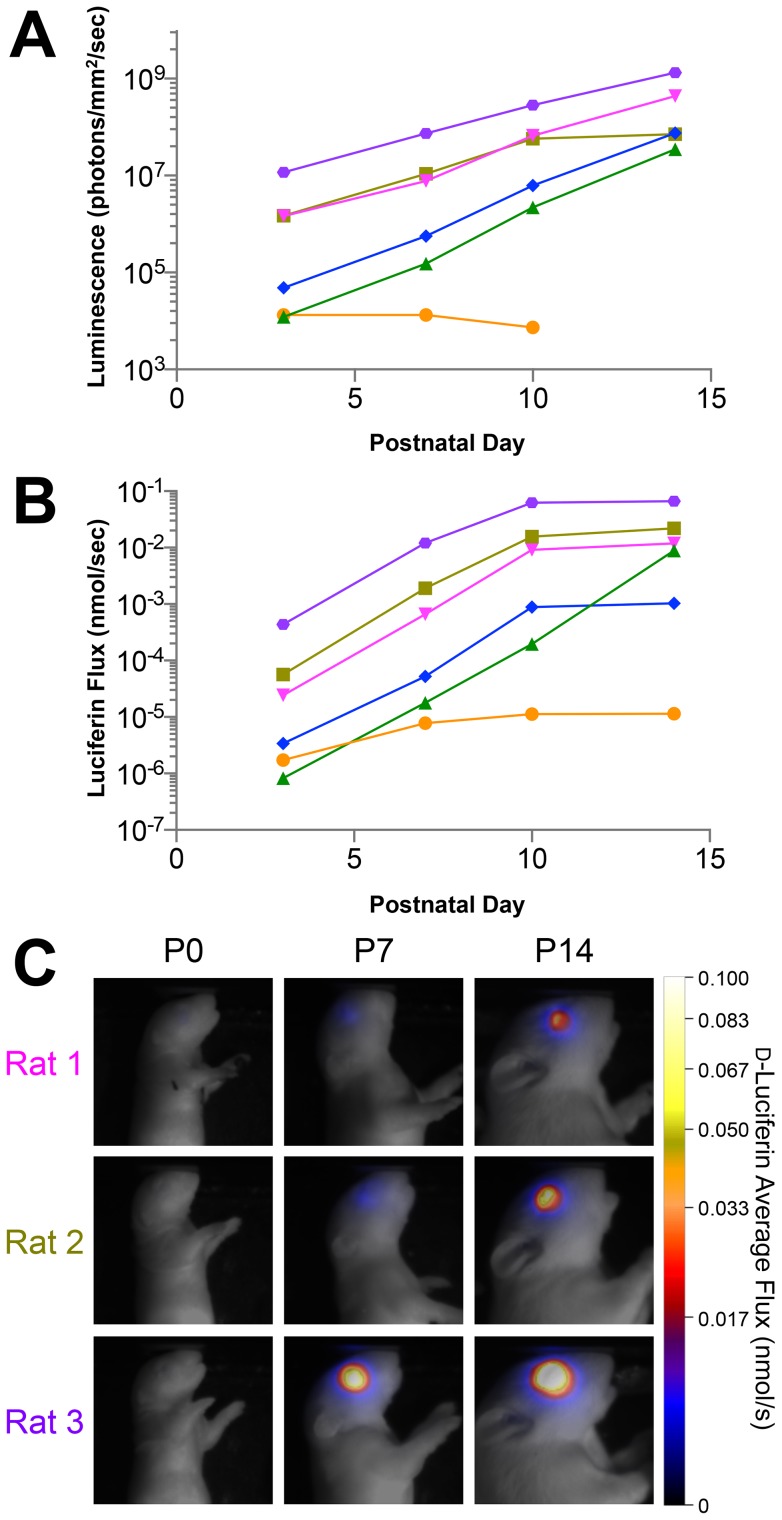
 ) modeled (Equations 1–3) from BLI data over the 14-day study. (C) Pseudo-color parametric images of
  for three representative animals at three timepoints, color-coded as in (A).
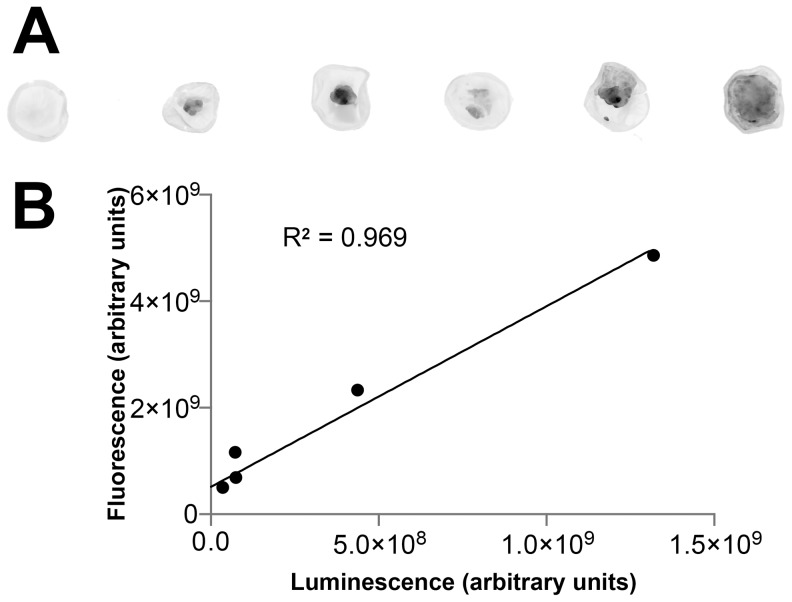
References
-
- Dimaras H, Kimani K, Dimba EA, Gronsdahl P, White A, et al. (2012) Retinoblastoma. Lancet 379: 1436–1446. - PubMed
-
- Rushlow DE, Mol BM, Kennett JY, Yee S, Pajovic S, et al. (2013) Characterisation of retinoblastomas without RB1 mutations: genomic, gene expression, and clinical studies. Lancet Oncol 14: 327–334. - PubMed
-
- Corson TW, Huang A, Tsao MS, Gallie BL (2005) KIF14 is a candidate oncogene in the 1q minimal region of genomic gain in multiple cancers. Oncogene 24: 4741–4753. - PubMed
-
- Orlic M, Spencer CE, Wang L, Gallie BL (2006) Expression analysis of 6p22 genomic gain in retinoblastoma. Genes Chromosomes Cancer 45: 72–82. - PubMed
Publication types
MeSH terms
Substances
Grants and funding
LinkOut - more resources
Full Text Sources
Other Literature Sources
Medical
Research Materials
