. 2014 Jun 5;9(6):e99001.
doi: 10.1371/journal.pone.0099001. eCollection 2014.

Src kinases regulate de novo actin polymerization during exocytosis in neuroendocrine chromaffin cells

Affiliations

Src kinases regulate de novo actin polymerization during exocytosis in neuroendocrine chromaffin cells

María José Olivares et al. PLoS One. .

Abstract

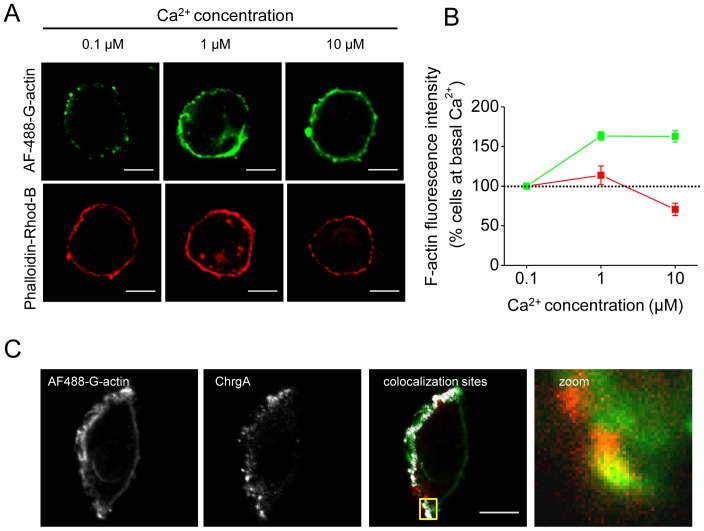
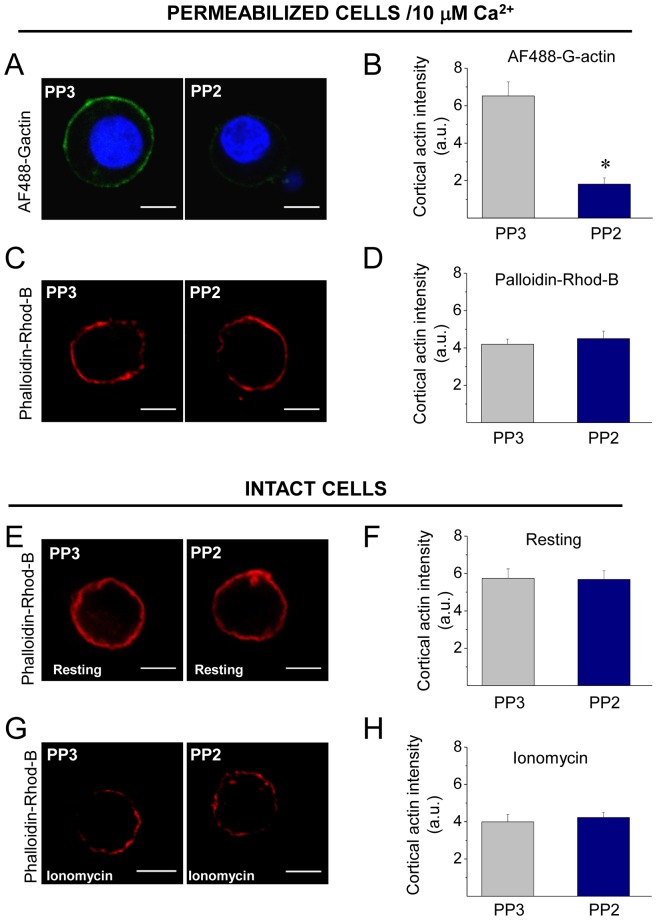
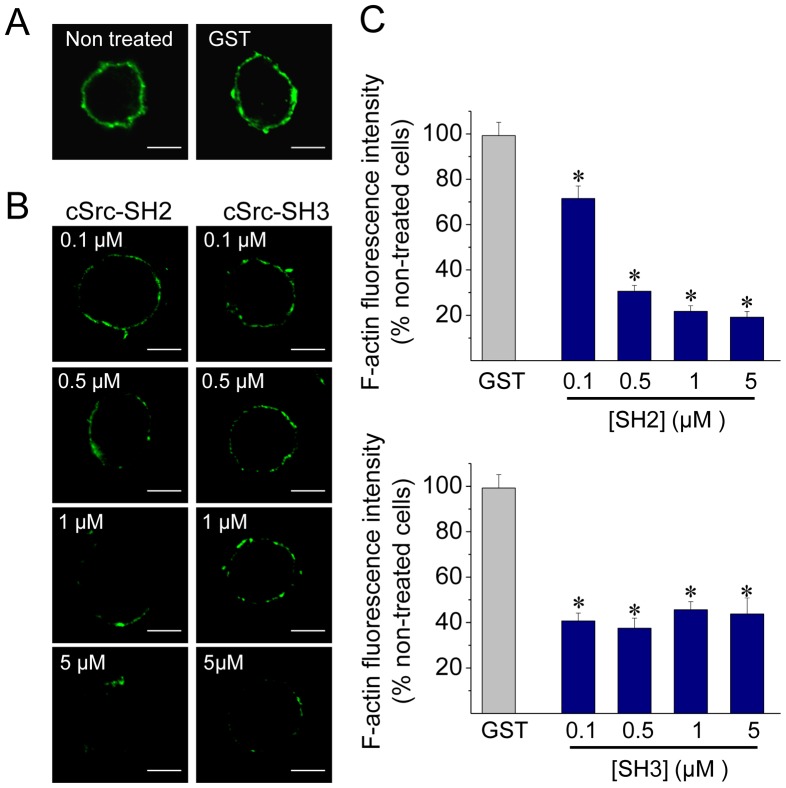
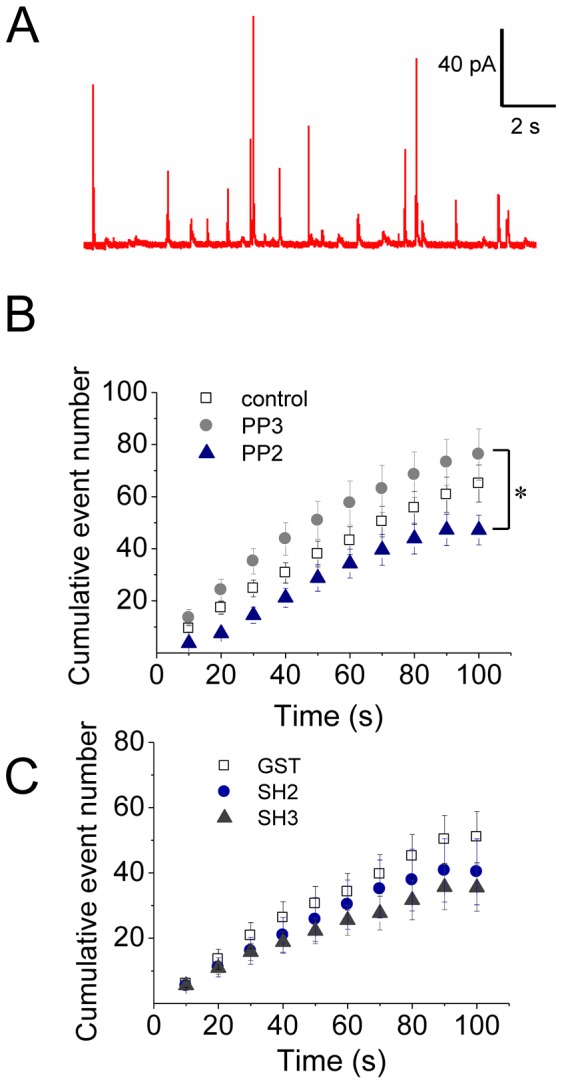
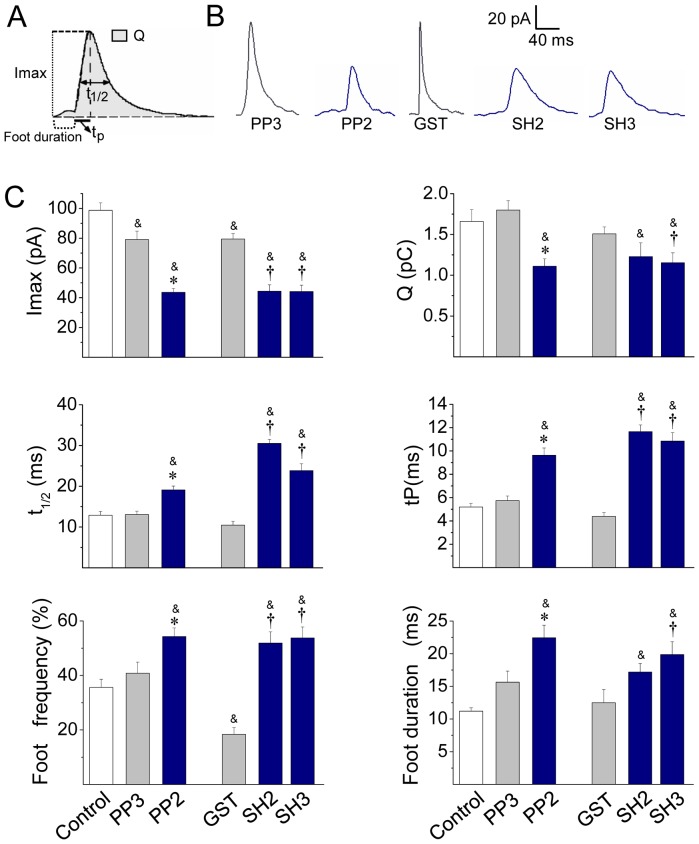
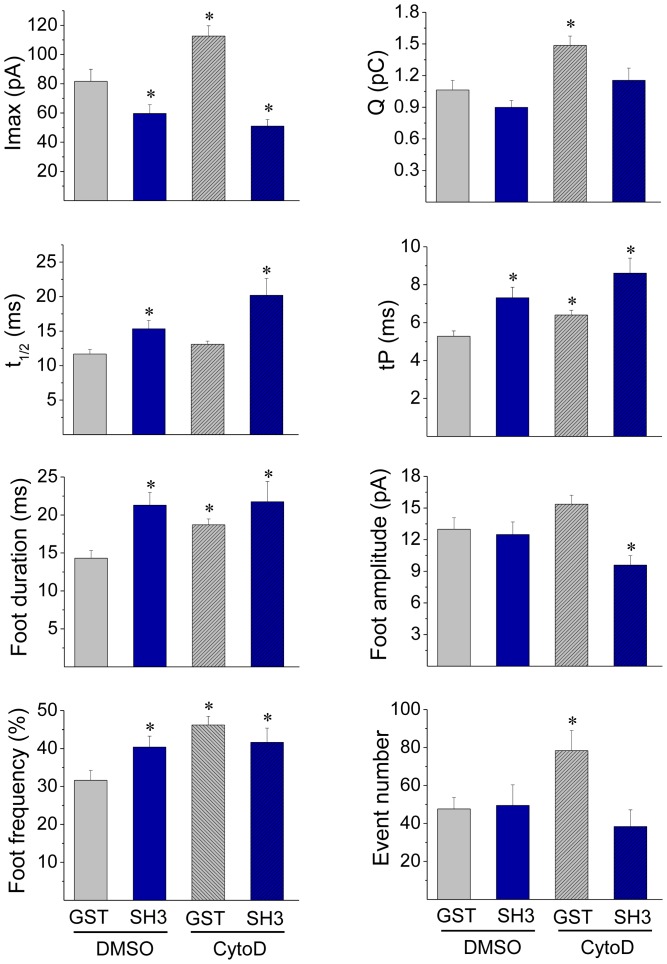
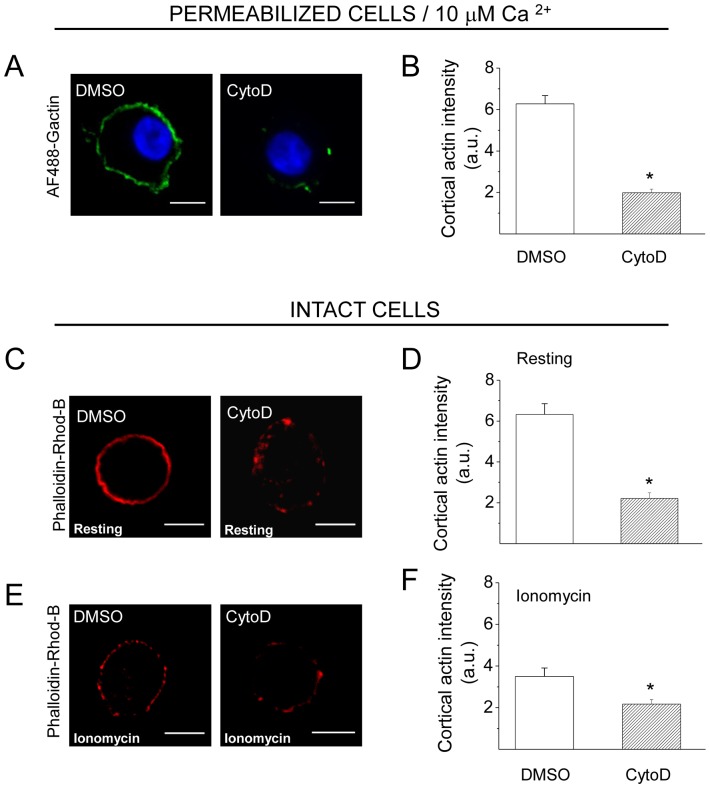
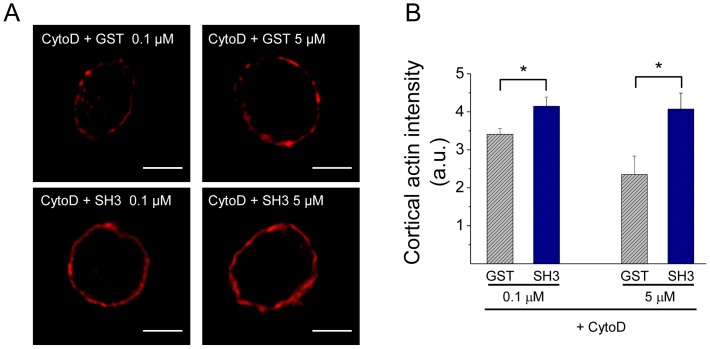
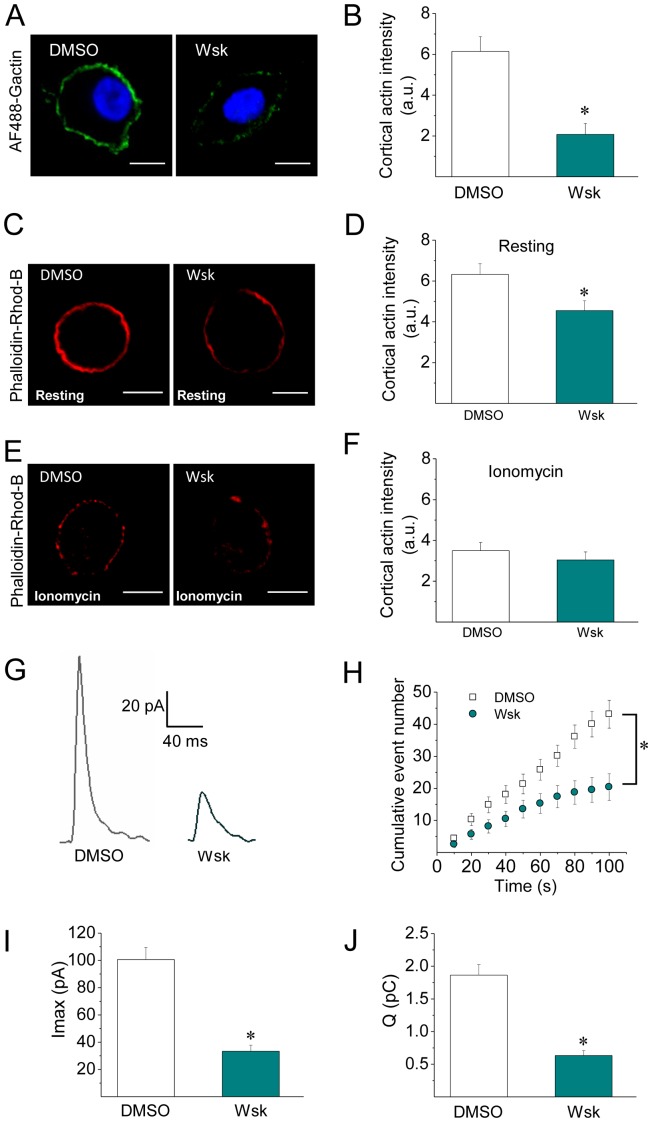
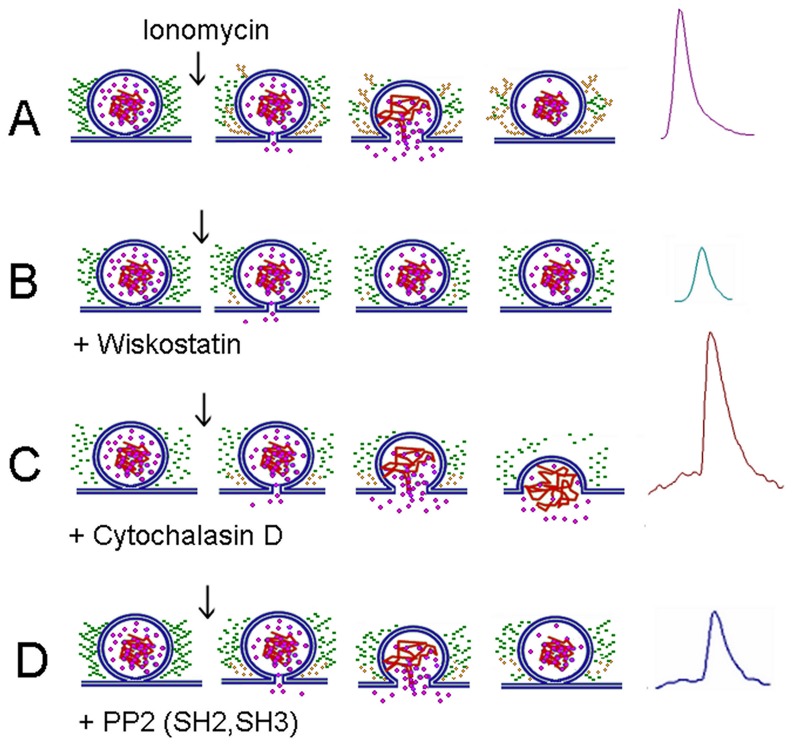
The cortical actin network is dynamically rearranged during secretory processes. Nevertheless, it is unclear how de novo actin polymerization and the disruption of the preexisting actin network control transmitter release. Here we show that in bovine adrenal chromaffin cells, both formation of new actin filaments and disruption of the preexisting cortical actin network are induced by Ca2+ concentrations that trigger exocytosis. These two processes appear to regulate different stages of exocytosis; whereas the inhibition of actin polymerization with the N-WASP inhibitor wiskostatin restricts fusion pore expansion, thus limiting the release of transmitters, the disruption of the cortical actin network with cytochalasin D increases the amount of transmitter released per event. Further, the Src kinase inhibitor PP2, and cSrc SH2 and SH3 domains also suppress Ca2+-dependent actin polymerization, and slow down fusion pore expansion without disturbing the cortical F-actin organization. Finally, the isolated SH3 domain of c-Src prevents both the disruption of the actin network and the increase in the quantal release induced by cytochalasin D. These findings support a model where a rise in the cytosolic Ca2+ triggers actin polymerization through a mechanism that involves Src kinases. The newly formed actin filaments would speed up the expansion of the initial fusion pore, whereas the preexisting actin network might control a different step of the exocytosis process.


Conflict of interest statement

Competing Interests: The authors have declared that no competing interests exist.

Figures

Figure 1
Figure 1. Ca2+-dependent cortical actin polymerization colocalizes with secretory granules in permeabilized chromaffin cells.
(A–B) Cultured ACCs were permeabilized in KGEP buffer for 6 minutes with 20 µM digitonin in the presence of increasing concentrations of free Ca2+ and 0.3 µM of Alexa Fluor 488 G-actin, fixed and visualized by confocal microscopy (top panel). Under these conditions, the actin ring corresponds to recently polymerized actin filaments. To evaluate the effect of growing free Ca2+ concentrations on the preexisting cortical actin ring, digitonin-permeabilized ACCs were fixed and stained with 1 µM phalloidin-rhodamine B (bottom panel). (B) Quantification of the cortical actin fluorescence intensity shows the coexistence of assembly (green line) and disassembly (red line) of the cortical actin network at 10 µM of free Ca2 compared to basal Ca2+ levels (0.1 µM). Data are means ± SEM from 20–22 cells. (C) ACCs permeabilized in the presence of Alexa Fluor 488 G-actin and 10 µM of free Ca2+ were fixed and immunolabeled with a specific antibody against the chromaffin granule marker chromogranin A. F-actin and chromogranin A images were thresholded and colocalization sites were automatically detected (white spots). A colocalization site is highlighted in yellow. Note that the newly polymerized actin (green) colocalizes with chromogranin A (red). The mean score for the Pearson Correlation Coefficient between chromogranin A and F-actin at these sites was 0.89±0.03 (n = 12). Scale bar  = 10 µm.
Figure 2
Figure 2. Inhibition of Src activity reduces Ca2+-dependent actin polymerization.
(A–B) To analyze the impact of Src kinase inhibition on actin dynamics, ACCs were permeabilized in the presence of Alexa Fluor 488 G actin, 10 µM free Ca2+ and 10 µM of the Src inhibitor PP2 or its inactive analogue PP3. (C–D) To evaluate the drug effects on the organization of the cortical actin network, cells were permeabilized with digitonin for 6 minutes in the presence of PP2 (or PP3), then fixed and stained with 1 µM phalloidin-rhodamine B. (E–H) Intact cells were incubated for 20 min with 10 µM PP2 (or PP3), maintained in resting condition (E–F) or stimulated with 20 µM ionomycin for 10 s (G–H), then fixed and stained with 1 µM phalloidin-rhodamine B to confocal visualization. A, C, E and G show representative confocal images for each condition. Scale bar  = 10 µm. B, D, F and H correspond to the quantification of the cortical actin fluorescence intensity, where data are means ± SEM from at least 16 cells per each condition (*p<0.05 compared with PP3). Note that Src kinases inhibition with PP2 reduces the new formation of cortical actin filaments, but it does not affect the cortical actin network in permeabilized or intact cells.
Figure 3
Figure 3. Disruption of c-Src SH2- or SH3-dependent associations inhibits de novo cortical actin assembly.
ACCs were permeabilized in the presence of Alexa Fluor 488 G-actin, 10 µM free Ca2+ and 5 µM GST alone or growing concentrations of cSrc SH2-GST (SH2) or cSrc SH3-GST (SH3). (A–B) Representative images showing the new formation of cortical actin in cells permeabilized without peptides (non-treated) and in the presence of GST (A), or with different amounts of SH2 (B, left panel) or SH3 (B, right panel). Scale bar  = 10 µm. (C) Quantification demonstrates that 0.1 µM of c-Src SH2 or SH3 domain is sufficient to significantly disrupt Ca2+-dependent actin polymerization in ACCs. Data are means ± SEM of fluorescence intensity from at least 10 cells per each condition. *p<0.05 compared to GST.
Figure 4
Figure 4. Src kinase inhibition reduces the number of exocytotic events.
ACCs were incubated with the Src kinase inhibitor PP2 (10 µM) or its inactive isomer PP3 for 20 min, or injected with 5 µM GST, or c-Src SH2-GST (SH2) or cSrc SH3-GST (SH3) domain. Exocytosis was induced with the Ca+2 ionophore ionomycin (20 µM) and monitored by amperometry. (A) A representative amperometric trace from a non-treated cell (Control). (B–C) Cumulative histograms of the number of amperometric events from non-treated cells (control), or cells treated with PP2 or PP3, or injected with GST, SH2 or SH3. Data are means ± SEM from 12–20 cells. *p<0.05 compared with PP3.
Figure 5
Figure 5. Src kinase inhibition slows down the fusion pore expansion.
Exocytosis was induced with 20 µM ionomycin and monitored by amperometry. Cells were incubated with 10 µM PP2 or its inactive isomer PP3 for 20 min before the exocytosis induction. These agents were present during the recording. GST, c-Src SH2-GST (SH2) or c-Src SH3-GST (SH3) was injected 30 min before cell stimulation. (A) Scheme of an amperometric spike with the analyzed parameters: peak amplitude (Imax), quantal size (Q), half-width (t1/2), rise time (tP) and food duration. (B) Representative amperometric spikes from cells treated with PP3 or PP2, or injected with GST, SH2 or SH3. (C) Data show average values ± S.E.M. of Imax, Q, t1/2, tP, foot frequency and foot duration of amperometric events in control cells (n = 35) or cells treated with PP3 (n = 15), PP2 (n = 20) or injected with GST (n = 13), SH2 (n = 12), SH3 (n = 15). All amperometric parameter values correspond to the median values of the events from individual cells, which were subsequently averaged per treatment group. &p<0.05 compared with control; *p<0.05 compared with PP3; p<0.05 compared with GST.
Figure 6
Figure 6. Cytochalasin D does not affect the quantal release in cells injected with the cSrc SH3 domain.
ACCs were injected with 5 µM GST or c-Src SH3-GST (SH3), and 20 min later incubated with 4 µM cytochalasin D (CytoD) or its vehicle DMSO for 10 min at 37°C. Then, exocytosis was induced with 20 µM ionomycin and monitored by amperometry. Data show average values ± S.E.M. of Imax, Q, t1/2, tP, foot duration, foot amplitude, foot frequency and number of events during the recording from cells injected with GST and treated with DMSO (n = 15) or CytoD (n = 16) or injected with SH3 treated with DMSO (n = 24) or CytoD (n = 14). All amperometric parameter values correspond to the median values of the events from individual cells, which were subsequently averaged per treatment group. *p<0.05 compared with cells injected with GST and treated with DMSO. Note that SH3 and CytoD have common effects in tP, foot duration and foot frequency, but show dissimilar effects on Imax and Q. In the latter parameters, the effects of c-Src-SH3 prevail over those of CytoD.
Figure 7
Figure 7. Cytochalasin D inhibits the new formation of actin filaments and disturbs the subplasmalemmal actin network in ACCs.
(A–B) Cultured chromaffin cells were permeabilized in the presence of 0.3 µM AF488-G-actin, 10 µM free Ca2+ and 4 µM of CytoD or the vehicle DMSO. Note that CytoD treatment drastically inhibited the de novo actin polymerization. (C–F) Intact cells were incubated for 10 minutes with 4 µM CytoD, or the vehicle DMSO, at 37°C, then maintained resting conditions (C–D) or stimulated with 20 µM ionomycin (E–F), fixed, stained with phalloidin-rhodamine B and visualized by confocal microscopy. Note that Cyto D significantly reduced the cortical F-actin signal in both, resting and stimulated cells. A, C and E show representative confocal images for each condition. Scale bar  = 10 µm. B, D and F correspond to quantification of the cortical actin fluorescence intensity, where data are means ± SEM from at least 15 cells per each condition. *p<0.05 compared to DMSO.
Figure 8
Figure 8. c-Src-SH3 diminishes the F-actin disruption induced by cytochalasin D.
ACCs were digitonin-permeabilized for 6 minutes in the presence of 10 µM free Ca2+, 4 µM cytochalasin D (CytoD) and GST or c-Src-SH3-GST (SH3) at 0.1 or 5 µM. Then cells were fixed and stained with 1 µM of phalloidin-rhodamine B. (A) Representative images of each experimental condition. Scale bar  = 10 µm. (B) Quantification of the cortical actin intensity fluorescence. Data are means ± SEM for at least 18 cells from 3 different cultures per each condition. Note a significantly higher cortical F-actin intensity in cells treated with CytoD in the presence of c-Src-SH3, at either 0.1 or 5 µM, as compared with cells treated with CytoD in the presence of GST (*p<0.05).
Figure 9
Figure 9. Inhibition of N-WASP activation suppresses de novo actin polymerization and reduces the quantal release of transmitters.
(A–B) ACCs were permeabilized in the presence of 10 µM free Ca2+ and 5 µM of the N-WASP inhibitor wiskostatin (Wsk), or the vehicle DMSO. The new F-actin formation was evaluated in the presence of 0.3 µM of AF488-G-actin. Note that Wsk treatment significantly disrupted the new F-actin polymerization. (C–F) Cultured ACC were incubated with the N-WASP inhibitor Wsk for 5 minutes at 37°C, then maintained in resting conditions (C–D) or stimulated with 20 µM ionomycin (E–F), fixed and stained with phalloidin-rhodamine B for confocal visualization. Note that Wsk slightly disturbs the cortical actin ring in resting cells, but it did not induce an additional F-actin disruption in ionomycin treated cells. A, C and E show representative confocal images for each condition. Scale bar  = 10 µm. B, D and F correspond to quantification of the cortical actin fluorescence intensity, where data are means ± SEM from at least 11 cells per each condition. *p<0.05 compared to DMSO. (G–J) Cultured ACCs were incubated with 5 µM Wsk for 5 min prior to the exocytosis induction, then this agent was kept during the amperometric recording. Representative amperometric spikes are shown in panel G. Data show average values ± S.E.M. of the number of cumulative exocytotic events (H), Imax (I) or Q (J) from cells treated with DMSO (n = 29) or Wsk (n = 15). The amperometric parameter values correspond to the median values of the events from individual cells, which were subsequently averaged per treatment group. Note that the inhibition of N-WASP activation with Wsk reduced the number of exocytotic events (D), and decreased the amplitude (E) and quantal size (F).*p<0.05 compared to DMSO.
Figure 10
Figure 10. Influence of the different treatments on actin dynamics.
(A) A stimulus that induces an increase in the cytosolic Ca2+ hastens SNARE-mediated fusion of secretory vesicles with the plasma membrane, but it also promotes both disruption of the preexisting actin network (green rosary beads) and the formation of new actin filaments (yellow rosary beads). This actin dynamics appears to favor the expansion of the fusion pore, but also prevents the collapse of the vesicle in the plasma membrane. This mechanism allows the fast release of soluble catecholamines (see the purple spike at the right). (B) The N-WASP inhibitor wiskostatin (Wks) strongly inhibits the new actin polymerization, while it slightly disturbs the preexisting cortical F-actin network (Figure 9). Such effect could be due to a reduction of the slow-rate of actin polymerization/depolymerization in resting conditions. Wsk also gives rise to incomplete release events (see the small green spike), suggesting that the lack of actin polymerization hinders the expansion of the fusion pore. Wsk could also perturb membrane transport, decreasing cellular ATP levels and Ca2+ entry . These effects could also contribute to the failure of the fusion pore expansion. (C) Cytochalasin D (CytoD) greatly disrupts the preexisting F-actin network, as well as the new F-actin formation (Figure 7). CytoD also slows down the fusion pore expansion and increases the quantal size of the release events (see the big brown spike with a long foot). Probably the loss of actin meshwork favors the collapse of the vesicle in the plasma membrane, as previously proposed by Doreian et al. . (D) The inhibition of Src kinases with PP2 suppresses the de novo F-actin formation, but it does not disturb the pre-existing cortical actin network (Fig. 2). PP2 also slows down the fusion pore expansion, and reduces the quantal size of the release events (note the small blue spike with a long foot). Similar effects were observed with the microinjections of cSrc-SH2 or -SH3 domains. These findings support the idea that the new F-actin formation favors the expansion of the fusion pore.

Similar articles

Cited by

References

    1. Trifaró JM, Rosé SD, Marcu MG (2000) Scinderin, a Ca2+-dependent actin filament severing protein that controls cortical actin network dynamics during secretion. Neurochem Res 25: 133–144. - PubMed
    1. Malacombe M, Bader MF, Gasman S (2006) Exocytosis in neuroendocrine cells: new tasks for actin. Biochim Biophys Acta 1763: 1175–1183. - PubMed
    1. Gasman S, Chasserot-Golaz S, Malacombe M, Way M, Bader MF (2004) Regulated Exocytosis in Neuroendocrine Cells: A Role for Subplasmalemmal Cdc42/N-WASP-induced Actin Filaments. Mol Biol Cell 15: 520–531. - PMC - PubMed
    1. Giner D, Neco P, Francés Mdel M, López I, Viniegra S, et al. (2005) Real-time dynamics of the F-actin cytoskeleton during secretion from chromaffin cells. J Cell Sci 118: 2871–2880. - PubMed
    1. Berberian K, Torres AJ, Fang Q, Kisler K, Lindau M (2009) F-actin and myosin II accelerate catecholamine release from chromaffin granules. J Neurosci 29: 863–870. - PMC - PubMed

Publication types

LinkOut - more resources