

Using HIV networks to inform real time prevention interventions
- PMID: 24901437
- PMCID: PMC4047027
- DOI: 10.1371/journal.pone.0098443
Using HIV networks to inform real time prevention interventions
Abstract
Objective: To reconstruct the local HIV-1 transmission network from 1996 to 2011 and use network data to evaluate and guide efforts to interrupt transmission.
Design: HIV-1 pol sequence data were analyzed to infer the local transmission network.
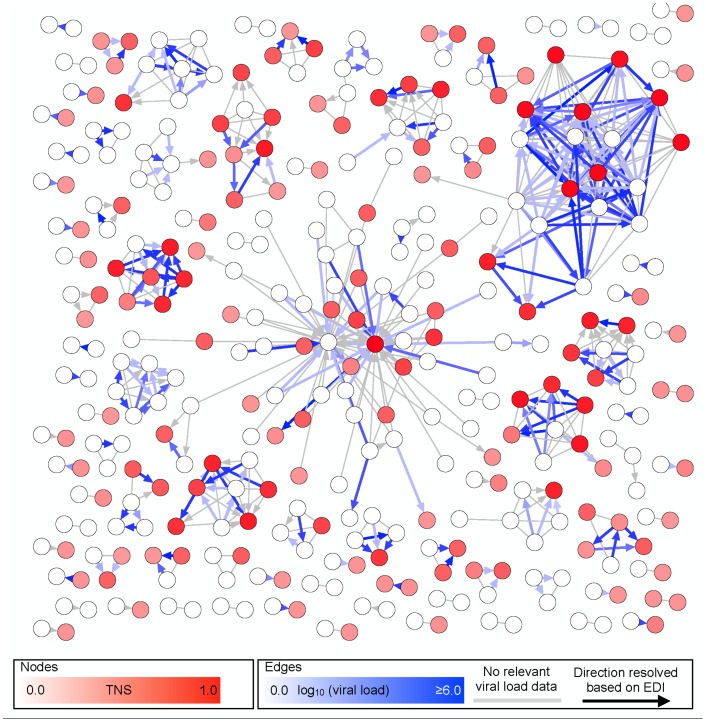
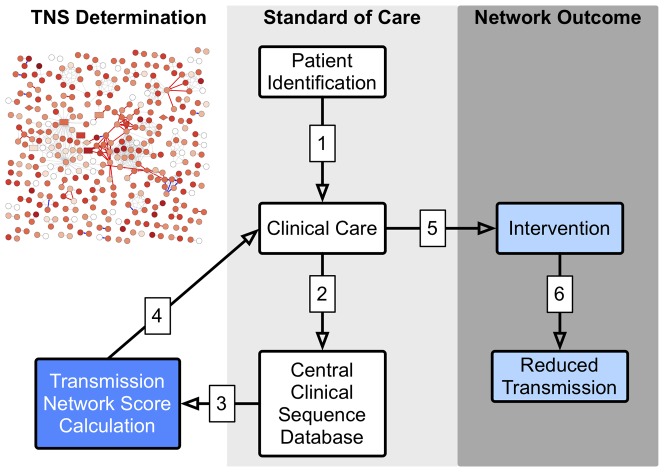
Methods: We analyzed HIV-1 pol sequence data to infer a partial local transmission network among 478 recently HIV-1 infected persons and 170 of their sexual and social contacts in San Diego, California. A transmission network score (TNS) was developed to estimate the risk of HIV transmission from a newly diagnosed individual to a new partner and target prevention interventions.
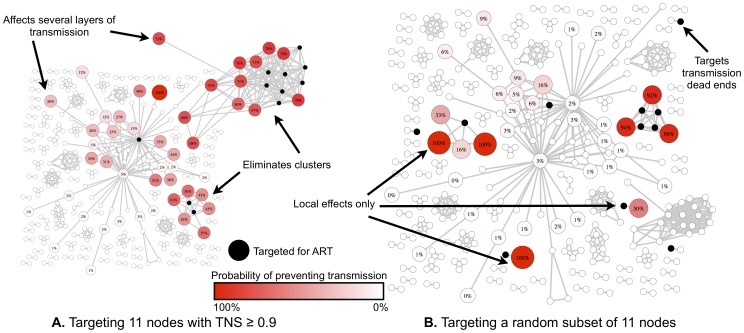
Results: HIV-1 pol sequences from 339 individuals (52.3%) were highly similar to sequences from at least one other participant (i.e., clustered). A high TNS (top 25%) was significantly correlated with baseline risk behaviors (number of unique sexual partners and insertive unprotected anal intercourse (p = 0.014 and p = 0.0455, respectively) and predicted risk of transmission (p<0.0001). Retrospective analysis of antiretroviral therapy (ART) use, and simulations of ART targeted to individuals with the highest TNS, showed significantly reduced network level HIV transmission (p<0.05).
Conclusions: Sequence data from an HIV-1 screening program focused on recently infected persons and their social and sexual contacts enabled the characterization of a highly connected transmission network. The network-based risk score (TNS) was highly correlated with transmission risk behaviors and outcomes, and can be used identify and target effective prevention interventions, like ART, to those at a greater risk for HIV-1 transmission.
Conflict of interest statement
Figures
References
Publication types
MeSH terms
Substances
Grants and funding
- K24 AI100665/AI/NIAID NIH HHS/United States
- AI067039/AI/NIAID NIH HHS/United States
- R01 AI047745/AI/NIAID NIH HHS/United States
- UM1 AI069432/AI/NIAID NIH HHS/United States
- AI080353/AI/NIAID NIH HHS/United States
- AI36214/AI/NIAID NIH HHS/United States
- MH083552/MH/NIMH NIH HHS/United States
- GM093939/GM/NIGMS NIH HHS/United States
- U01 AI043638/AI/NIAID NIH HHS/United States
- DP1 DA034978/DA/NIDA NIH HHS/United States
- MH62512/MH/NIMH NIH HHS/United States
- R01 MH083552/MH/NIMH NIH HHS/United States
- R24 AI106039/AI/NIAID NIH HHS/United States
- MH097520/MH/NIMH NIH HHS/United States
- R21 AI047745/AI/NIAID NIH HHS/United States
- R01 GM093939/GM/NIGMS NIH HHS/United States
- R24 AI067039/AI/NIAID NIH HHS/United States
- K23 AI093163/AI/NIAID NIH HHS/United States
- AI96189/AI/NIAID NIH HHS/United States
- U01 AI069432/AI/NIAID NIH HHS/United States
- AI74621/AI/NIAID NIH HHS/United States
- R56 AI047745/AI/NIAID NIH HHS/United States
- R24 TW008908/TW/FIC NIH HHS/United States
- R21 AI080353/AI/NIAID NIH HHS/United States
- DA034978/DA/NIDA NIH HHS/United States
- P30 MH062512/MH/NIMH NIH HHS/United States
- P30 AI036214/AI/NIAID NIH HHS/United States
- R01 AI096189/AI/NIAID NIH HHS/United States
- AI100665/AI/NIAID NIH HHS/United States
- K01 AI110181/AI/NIAID NIH HHS/United States
- U19 AI096113/AI/NIAID NIH HHS/United States
- TW008908/TW/FIC NIH HHS/United States
- R21 AI097061/AI/NIAID NIH HHS/United States
- R01 MH097520/MH/NIMH NIH HHS/United States
- AI097061/AI/NIAID NIH HHS/United States
- AI43638/AI/NIAID NIH HHS/United States
- AI090970/AI/NIAID NIH HHS/United States
- U19 AI090970/AI/NIAID NIH HHS/United States
- AI47745/AI/NIAID NIH HHS/United States
- AI106039/AI/NIAID NIH HHS/United States
- AI69432/AI/NIAID NIH HHS/United States
- P01 AI074621/AI/NIAID NIH HHS/United States
- AI093163/AI/NIAID NIH HHS/United States
- R01 MH100974/MH/NIMH NIH HHS/United States
- AI096113/AI/NIAID NIH HHS/United States
LinkOut - more resources
Full Text Sources
Other Literature Sources
Medical
Molecular Biology Databases
