. 2014 Jun 5;10(6):e1004299.
doi: 10.1371/journal.pgen.1004299. eCollection 2014 Jun.

Rosa26-GFP direct repeat (RaDR-GFP) mice reveal tissue- and age-dependence of homologous recombination in mammals in vivo

Affiliations

Rosa26-GFP direct repeat (RaDR-GFP) mice reveal tissue- and age-dependence of homologous recombination in mammals in vivo

Michelle R Sukup-Jackson et al. PLoS Genet. .

Abstract

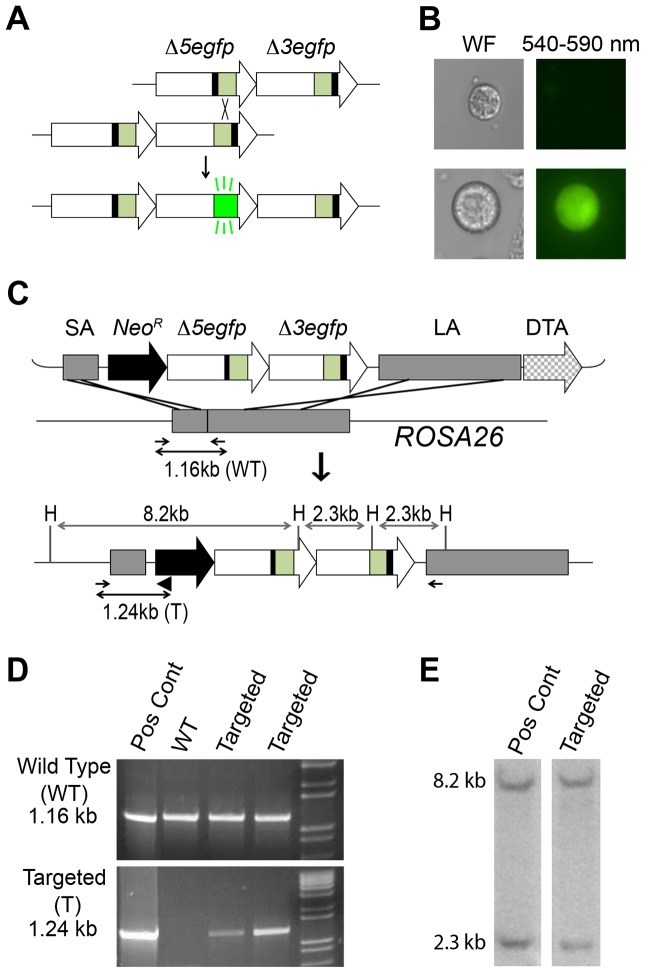
Homologous recombination (HR) is critical for the repair of double strand breaks and broken replication forks. Although HR is mostly error free, inherent or environmental conditions that either suppress or induce HR cause genomic instability. Despite its importance in carcinogenesis, due to limitations in our ability to detect HR in vivo, little is known about HR in mammalian tissues. Here, we describe a mouse model in which a direct repeat HR substrate is targeted to the ubiquitously expressed Rosa26 locus. In the Rosa26 Direct Repeat-GFP (RaDR-GFP) mice, HR between two truncated EGFP expression cassettes can yield a fluorescent signal. In-house image analysis software provides a rapid method for quantifying recombination events within intact tissues, and the frequency of recombinant cells can be evaluated by flow cytometry. A comparison among 11 tissues shows that the frequency of recombinant cells varies by more than two orders of magnitude among tissues, wherein HR in the brain is the lowest. Additionally, de novo recombination events accumulate with age in the colon, showing that this mouse model can be used to study the impact of chronic exposures on genomic stability. Exposure to N-methyl-N-nitrosourea, an alkylating agent similar to the cancer chemotherapeutic temozolomide, shows that the colon, liver and pancreas are susceptible to DNA damage-induced HR. Finally, histological analysis of the underlying cell types reveals that pancreatic acinar cells and liver hepatocytes undergo HR and also that HR can be specifically detected in colonic somatic stem cells. Taken together, the RaDR-GFP mouse model provides new understanding of how tissue and age impact susceptibility to HR, and enables future studies of genetic, environmental and physiological factors that modulate HR in mammals.


Conflict of interest statement

The authors have declared that no competing interests exist.

Figures

Figure 1
Figure 1. Targeted integration of the RaDR-GFP HR substrate.
(A) The RaDR-GFP HR substrate consists of two EGFP expression cassettes arranged in tandem (large arrows), each of which is missing essential sequences: deletions at the 5′ (Δ5) and 3′ (Δ3) ends of the coding sequences are indicated by black bars. Coding sequences are in green, and the CAG promoter and polyadenylation (pA) signal sequences are in white. (B) Most cells harboring the RaDR-GFP substrate are non-fluorescent (top) while rare HR events give rise to fluorescent cells (bottom). (C) The RaDR-GFP targeting vector (top) is comprised of a Rosa26 short arm (SA), a positive selection cassette (Neo R), the GFP direct repeat HR substrate (described in A), a long arm (LA) and the diphtheria toxin fragment A (DTA) negative selection cassette. Targeted integration gives rise to an 8.2 and 2.3 kb HindIII (H) fragment. PCR primers (small arrows) amplify the wild type genomic DNA (1.16 kb) whereas the targeted allele is amplified when a third primer (black triangle) is opposed to the forward primer to give rise to a 1.24 kb product. (D) PCR analysis of a positive control clone, wild type cells and two examples of targeted clones. (E) HindIII digested genomic DNA probed with the EGFP cDNA reveals 8.2 and 2.3 kb fragments specific to correctly targeted clones.
Figure 2
Figure 2. HR leads to reconstitution of full-length EGFP coding sequence within green fluorescent RaDR-GFP pancreatic cells.
(A) PCR primers (P1–P6) that specifically amplify full length EGFP, Δ3egfp, and Δ5egfp yield the indicated sized fragments (see [66]). Hatched regions indicate unique sequences inserted at the site of the deletions enabling the design of cassette specific primers. (B) Relative fluorescence intensity for 515–545 nm (y axis) and 562–588 nm (x axis), respectively. Expression of EGFP leads to a shift to the right. Bracket is drawn to capture the majority of the green fluorescent EGFP positive cells, while excluding autofluorescent cells. (C) PCR analysis using primers that specifically amplify Δ3egfp, Δ5egfp, and full length EGFP to yield a 415, 250 and 740 bp product, respectively. Products are not observed in WT cells (left panel; ladder in lane 1). PCR analysis of targeted clones that each harbor the indicated cassettes demonstrates the specificity of the PCR conditions for each cassette. ES cells used to create the RaDR-GFP mice harbor the Δ3egfp and Δ5egfp cassettes, consistent with the presence of the unrecombined HR substrate. (D) Fluorescence activated cell sorting and PCR of autofluorescent and green fluorescent pancreatic cells from RaDR-GFP mice reveals the presence of the Δ3egfp and Δ5egfp cassettes (from the unrecombined HR substrate). Full length EGFP coding sequence is uniquely present in the population of green fluorescent cells, consistent with reconstitution of full-length EGFP sequence following HR.
Figure 3
Figure 3. HR at the RaDR-GFP substrate can give rise to fluorescence following gene conversion, sister chromatid exchange, and replication fork repair, but not following SSA.
Each cassette is missing different essential coding sequences such that neither is able to express EGFP. Gene conversion can lead to transfer of sequence information from one cassette to the other, restoring full-length EGFP coding sequence and giving rise to a fluorescent readout. Each cassette can be the donor or the recipient in a gene conversion event. The entire HR reporter is copied during S phase, making it possible for crossovers between sister chromatids (gene conversion with crossover) to reconstitute full-length EGFP. Note that a long tract gene conversion event would be indistinguishable. Recombination that arises as a consequence of repair of a broken replication fork can also be detected using the RaDR-GFP substrate. A replication fork breakdown arising from a fork moving from left to right is shown. Reinsertion of the broken Δ3egfp end into the Δ5egfp cassette can restore full length EGFP. Note that this figure depicts events wherein the replication fork had been moving from left to right; EGFP can analogously be restored by repair of forks moving in the opposite direction (not shown). Single strand annealing initiated by a DSB between the repeated cassettes can be readily repaired, but these events will not reconstitute full-length EGFP and thus SSA cannot be detected.
Figure 4
Figure 4. Analysis of EYFP and EGFP positive control mice and RaDR-GFP tissues.
(A) Histological images of FYDR positive control mice that harbor full-length EYFP sequences within mouse Ch. 1, and RaDR-GFP positive control mice that harbor full-length EGFP at the Rosa26 locus expressed under the same CAG promoter (see Materials and Methods). Brightness/contrast for EYFP filtered images (×10) was adjusted equivalently for all images. (B) Quantification of percentage of cells that are fluorescent within disaggregated pancreas, liver and colon of the FYDR and RaDR-GFP positive control mice (measured using flow cytometry). Almost no cells are fluorescent in liver and colon cells from the positive control FYDR mice, indicating that these tissues cannot be used for analysis of HR in the FYDR mice. Almost all cells from the pancreas, liver and colon of the RaDR-GFP positive control mice are fluorescent, indicating that these tissues can be analyzed for HR frequency in the RaDR-GFP mice. (C) Frequency of HR among 11 different tissues from two months old RaDR-GFP mice is highly variable. The number of recombinant cells per million is reported as individual data points (one data point for each mouse; samples from 9–10 mice were analyzed for each type of tissue). Horizontal lines that capture more than one tissue type indicate that samples within that group are not statistically significantly different from one another. Statistically significant differences between groups (of one or more tissue types) are noted. Bars indicate median frequencies.
Figure 5
Figure 5. Fluorescence detection of recombinant cells within intact tissues of FYDR and RaDR-GFP mice and identification of the underlying cell types.
(A) Analysis of pancreatic tissue from FYDR mice. Foci can be detected within images of the entire organ compressed to 0.5 mm (left image is at ×1, scale bar = 1 cm). Foci are readily quantifiable at ×5 (middle image, scale bar = 1 mm). Histological image of H&E stained section (right image at ×60, scale bar = 20 µm) overlaid with fluorescence image (510–560 nm filter). Brightness/contrast for fluorescent images was optimized for each histological section. Fluorescence is pseudocolored. (B) Analysis of pancreatic tissue (nearly the entire organ) from a RaDR-GFP mouse compressed to 0.5 mm. Nuclei are stained with Hoechst; fluorescent recombinant cells are pseudocolored green. (C) In situ detection of recombinant cells within pancreas, liver and colon from RaDR-GFP mice. Image collection was done according to (A). Recombinant pancreatic acinar cells, liver hepatocytes and colonic epithelial cells are quantifiable within freshly excised tissues (left and middle images). Cell types can be discerned using H&E overlay (right images). (D) Crypt model emphasizing that recombinant transit cells are rapidly lost, while recombinant somatic stem cells can give rise to a persistent wholly fluorescent crypt. (E) Analysis of disaggregated crypts reveals the presence of non-fluorescent crypts (left) and crypts in which essentially all of the epithelial cells fluoresce (right).
Figure 6
Figure 6. Recombinant cells accumulate with age in the colon.
(A) Image analysis with in-house software designed to detect large foci with consistent morphology. Note that small foci and irregularly shaped foci are not designated positive by the program (compare left and right images; “+” symbols indicate foci identified by the program). (B) Freshly excised colonic tissue opened to reveal the lumen is pressed between coverslips and imaged using an epifluorescent microscope. (C) Image analysis using in-house software marks large foci with a dark cross. Comparing B and C shows that most of the large foci (bright white spots) are recognized by the program (dark cross marks). (D) Quantification of recombination events by analysis of foci frequency in the colon. Each symbol indicates the foci frequency for tissue from a single mouse (N = 5–6). The entire surface area was imaged in order to suppress the impact of variation in different regions of each tissue. Images were compiled, and the frequency of foci was determined for the entire organ, which was then divided by the surface area (determined using ImageJ). Each symbol represents the average number of foci/cm2 for the entire organ from each animal in cohorts of juvenile and aged animals. Bars indicate medians. Both small and large foci were counted manually (left). The same samples, when analyzed using in-house software that identifies large crypts, shows a statistically significant increase in the aged animals (p<0.01, Student's t-test) (right). Large foci are consistent with HR in colonic somatic stem cells that lead to wholly fluorescent crypts.
Figure 7
Figure 7. HR events are induced by exposure to an exogenous DNA damaging agent and are quantifiable using in-house software.
(A) Images of freshly excised liver and colon tissue from control mice and from mice that were exposed to MNU/T3. (B) Images of pancreata from control and MNU/T3 treated RaDR-GFP mice. (C) Analysis of images from part (B) using in-house software to quantify fluorescent foci. Foci identified by the program are indicated by “+”. (D) Frequencies of recombinant foci per cm2 in pancreatic, liver and colon tissue quantified using in-house software (controls N = 7–8; treated N = 12–13). Brightness and contrast for all images were optimized for publication. * p<0.05, Mann–Whitney U-test.

Similar articles

Cited by

References

    1. Friedberg EC, Walker GC, Siede W, Wood RD, Schultz RA, et al... (2006) DNA Repair and Mutagenesis. Washington, DC: ASM Press.
    1. Hoeijmakers JH (2009) DNA damage, aging, and cancer. N Engl J Med 361: 1475–1485. - PubMed
    1. Lieber MR (2008) The mechanism of human nonhomologous DNA end joining. J Biol Chem 283: 1–5. - PubMed
    1. Moynahan ME, Jasin M (2010) Mitotic homologous recombination maintains genomic stability and suppresses tumorigenesis. Nat Rev Mol Cell Biol 11: 196–207. - PMC - PubMed
    1. Helleday T, Lo J, van Gent DC, Engelward BP (2007) DNA double-strand break repair: from mechanistic understanding to cancer treatment. DNA Repair (Amst) 6: 923–935. - PubMed

Publication types

Substances