

Body fat percentage is a major determinant of total bilirubin independently of UGT1A1*28 polymorphism in young obese
- PMID: 24901842
- PMCID: PMC4046990
- DOI: 10.1371/journal.pone.0098467
Body fat percentage is a major determinant of total bilirubin independently of UGT1A1*28 polymorphism in young obese
Abstract
Objectives: Bilirubin has potential antioxidant and anti-inflammatory properties. The UGT1A1*28 polymorphism (TA repeats in the promoter region) is a major determinant of bilirubin levels and recent evidence suggests that raised adiposity may also be a contributing factor. We aimed to study the interaction between UGT1A1 polymorphism, hematological and anthropometric variables with total bilirubin levels in young individuals.
Methods: 350 obese (mean age of 11.6 years; 52% females) and 79 controls (mean age of 10.5 years; 59% females) were included. Total bilirubin and C-reactive protein (CRP) plasma levels, hemogram, anthropometric data and UGT1A1 polymorphism were determined. In a subgroup of 74 obese and 40 controls body composition was analyzed by dual-energy X-ray absorptiometry.
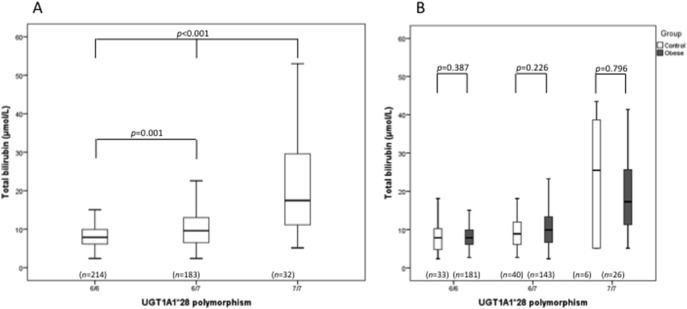
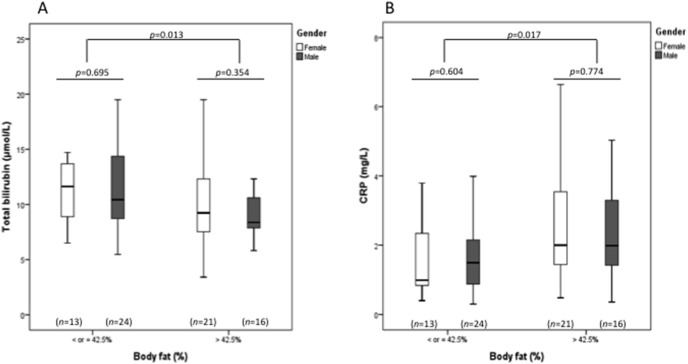
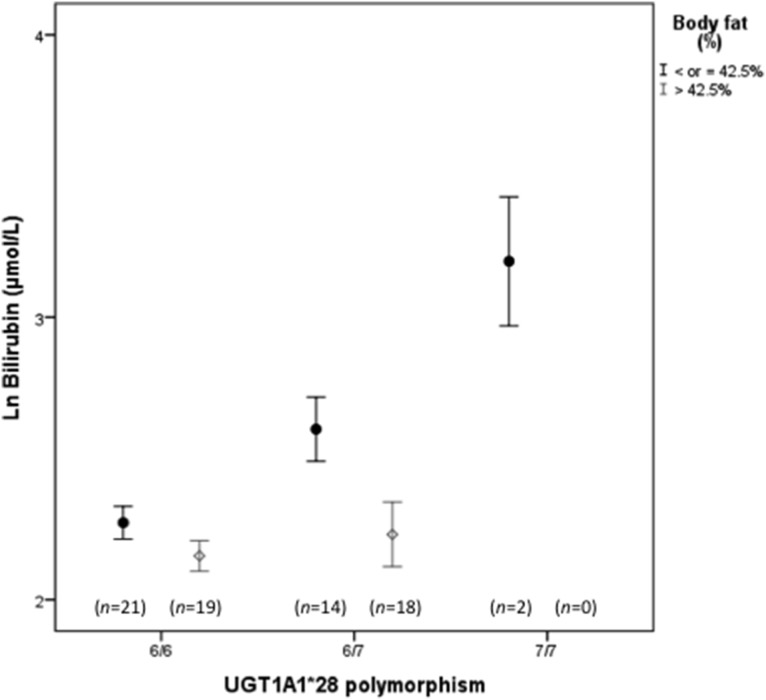
Results: The UGT1A1 genotype frequencies were 49.9%, 42.7% and 7.5% for 6/6, 6/7 and 7/7 genotypes, respectively. Patients with 7/7 genotype presented the highest total bilirubin levels, followed by 6/7 and 6/6 genotypes. Compared to controls, obese patients presented higher erythrocyte count, hematocrit, hemoglobin and CRP levels, but no differences in bilirubin or in UGT1A1 genotype distribution. Body fat percentage was inversely correlated with bilirubin in obese patients but not in controls. This inverse association was observed either in 6/7 or 6/6 genotype obese patients. UGT1A1 polymorphism and body fat percentage were the main factors affecting bilirubin levels within obese patients (linear regression analysis).
Conclusion: In obese children and adolescents, body fat composition and UGT1A1 polymorphism are independent determinants of total bilirubin levels. Obese individuals with 6/6 UGT1A1 genotype and higher body fat mass may benefit from a closer clinical follow-up.
Conflict of interest statement
Figures
References
-
- Fevery J (2008) Bilirubin in clinical practice: a review. Liver Int 28: 592–605. - PubMed
-
- Gong QH, Cho JW, Huang T, Potter C, Gholami N, et al. (2001) Thirteen UDPglucuronosyltransferase genes are encoded at the human UGT1 gene complex locus. Pharmacogenetics 11: 357–368. - PubMed
-
- Bosma PJ, Chowdhury JR, Bakker C, Gantla S, de Boer A, et al. (1995) The genetic basis of the reduced expression of bilirubin UDP-glucuronosyltransferase 1 in Gilbert’s syndrome. N Engl J Med 333: 1171–1175. - PubMed
-
- Kaniwa N, Kurose K, Jinno H, Tanaka-Kagawa T, Saito Y, et al. (2005) Racial variability in haplotype frequencies of UGT1A1 and glucuronidation activity of a novel single nucleotide polymorphism 686C>T (P229L) found in an African-American. Drug Metab Dispos 33: 458–465. - PubMed
Publication types
MeSH terms
Substances
LinkOut - more resources
Full Text Sources
Other Literature Sources
Medical
Research Materials
Miscellaneous
