. 2014 Jun 5;10(6):e1004406.
doi: 10.1371/journal.pgen.1004406. eCollection 2014 Jun.

Microbial succession in the gut: directional trends of taxonomic and functional change in a birth cohort of Spanish infants

Affiliations

Microbial succession in the gut: directional trends of taxonomic and functional change in a birth cohort of Spanish infants

Yvonne Vallès et al. PLoS Genet. .

Abstract

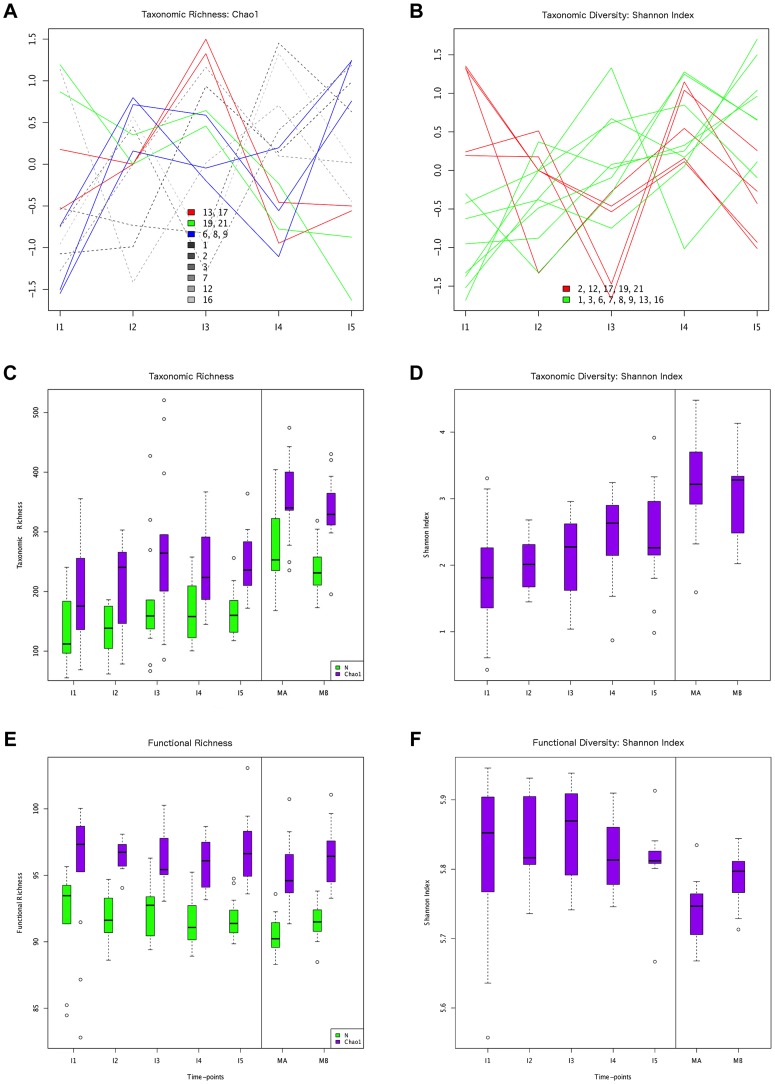
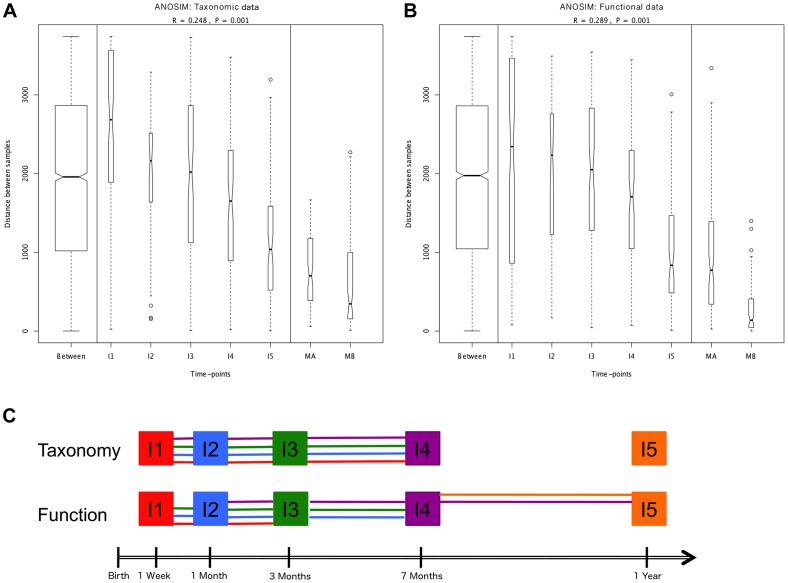
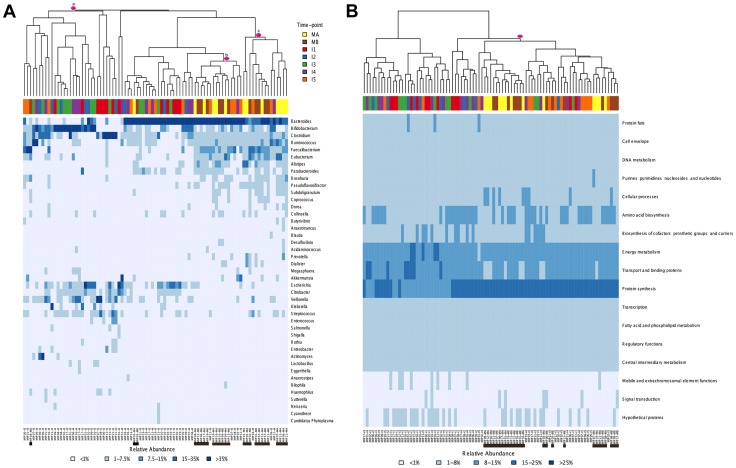
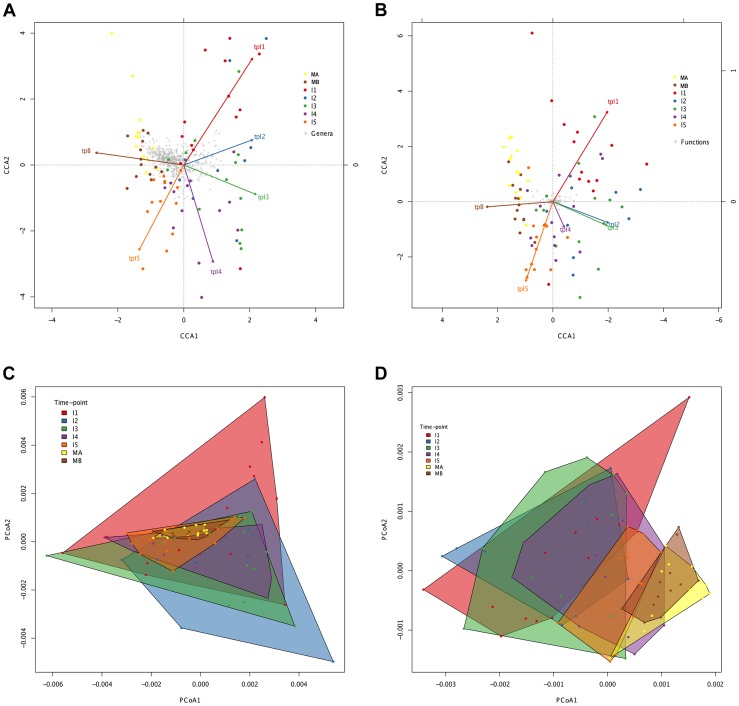
In spite of its major impact on life-long health, the process of microbial succession in the gut of infants remains poorly understood. Here, we analyze the patterns of taxonomic and functional change in the gut microbiota during the first year of life for a birth cohort of 13 infants. We detect that individual instances of gut colonization vary in the temporal dynamics of microbiota richness, diversity, and composition at both functional and taxonomic levels. Nevertheless, trends discernible in a majority of infants indicate that gut colonization occurs in two distinct phases of succession, separated by the introduction of solid foods to the diet. This change in resource availability causes a sharp decrease in the taxonomic richness of the microbiota due to the loss of rare taxa (p = 2.06e-9), although the number of core genera shared by all infants increases substantially. Moreover, although the gut microbial succession is not strictly deterministic, we detect an overarching directionality of change through time towards the taxonomic and functional composition of the maternal microbiota. Succession is however not complete by the one year mark, as significant differences remain between one-year-olds and their mothers in terms of taxonomic (p = 0.009) and functional (p = 0.004) microbiota composition, and in taxonomic richness (p = 2.76e-37) and diversity (p = 0.016). Our results also indicate that the taxonomic composition of the microbiota shapes its functional capacities. Therefore, the observed inter-individual variability in taxonomic composition during succession is not fully compensated by functional equivalence among bacterial genera and may have important physiological consequences. Finally, network analyses suggest that positive interactions among core genera during community assembly contribute to ensure their permanence within the gut, and highlight an expansion of complexity in the interactions network as the core of taxa shared by all infants grows following the introduction of solid foods.


Conflict of interest statement

The authors have declared that no competing interests exist.

Figures

Figure 1
Figure 1. Different behaviors of taxonomic and functional richness and diversity through infant gut microbiota development.
Hierarchical clustering of temporal profiles for (A) taxon richness (Chao1 estimator) and (B) taxon diversity (Shannon index), showing the extent of variation among the 13 infants. Values are centered at the mean of all samples and scaled by the standard deviation. Colored profile clusters have >95% support based on multiscale bootstrap resampling. The boxplots in (C) and (D) summarize the general behavior of taxon richness and diversity for all infants. Taxon richness (C) shows an increase in median values with time interrupted by the introduction of solid foods (I4), when a decrease in richness is observed. Taxon diversity (B) shows an increase in median values from I1 to I4 followed by a decrease between I4 and I5. Functional richness (E) and diversity (F) show no specific pattern but rather fluctuate with time.
Figure 2
Figure 2. ANOSIM comparison of timepoints.
Overall analyses for taxonomic (A) and functional (B) Bray-Curtis distances among all samples. The length of the bows indicates the level of heterogeneity and the width the number of compared samples. Statistically significant differences among timepoints are detected for both taxonomic and functional data. Note the decrease in heterogeneity with time in infants and the larger heterogeneity in MA compared to MB samples. (C) Representation of pairwise ANOSIM analyses between timepoints. Each timepoint is represented by a color and is linked by lines of this color to all timepoints from which it is not significantly different. For functional composition, significant differences appear between timepoints that are more separated in time, indicating directionality along infant development, but no such pattern is detected at the taxonomic level.
Figure 3
Figure 3. Heatmaps and clustering of individual gut microbiota samples for taxonomic (A) and functional composition (B).
Clustering was based on Bray-Curtis distances. (A) Only the genera above 1% abundance in at least one sample are depicted. (B) Functional composition was established based on TIGRFAM main functional roles. Each sample is identified at the bottom of the heatmaps by a code that specifies the MIP to which it belongs and the corresponding timepoint. Maternal samples are additionally highlighted by means of black bars. Colors on top of each heatmap represent the timepoints to which samples belong. Pink circles identify specific clusters referred to in the text.
Figure 4
Figure 4. Directionality in taxonomic and functional change through time.
Canonical Correspondence Analysis (CCA) of taxonomic (A) and functional (B) data, showing that the main axis (CCA1) separates infant timepoints I1, I2, I3 and I4 from I5, MA and MB. The percent variation explained by the main axis is 60.22% in A and 81.57% in B, while CCA2 explains 14.20% variation in A and 6.99% in B. The direction of the timepoint arrows indicates the main axis of deviation from the reference maternal timepoint (MA). Taxonomic (C) and functional (D) Principal Coordinates Analyses (PCoA) depicting convex hulls enclosing all samples pertaining to a determined timepoint. The percent variation explained by the main axis is 46.60% in C and 30.28% in D, while PCoA2 explains 23.00% variation in C and 16.04% in D. Heterogeneity within timepoints is represented by arrow length (CCA) or convex hull area (PCoA). All analyses identify a progressive change from timepoint to timepoint with clear directionality towards the composition of the mothers.
Figure 5
Figure 5. Dendrogram showing six main groups of gut microbiota genera based on functional profile clustering.
Functional profiles were defined as the relative abundances of TIGRFAM subroles in a given genus. Only genera present in any sample at >1% abundance and having genes representing at least 50% of the 108 subroles detected in our complete data set were included. Clustering was based on the complete linkage method applied to a matrix of pairwise Bray-Curtis distances between the functional profiles of genera. Branches in the resulting dendrogram were collapsed when genera on the tips pertained to the same order. Orders of the same phylum have different shades of the same color.
Figure 6
Figure 6. Timecore Venn diagrams.
Changes in the core sets of genera (A) or functions (B) present at each infant timepoint. In both cases, areas representing the different timecores are enclosed by lines of the corresponding colors. The red central circles represent the genera or functions present in all five infant timecores; areas filled in dark orange, medium orange, light orange and yellow represent features present in four, three, two or one infant timecores. The number of features included in each section of the diagram is shown and areas are approximately proportional to these numbers.
Figure 7
Figure 7. Potential taxon interactions during assembly of the gut microbiota.
The represented subnetwork links all genera present in the different infant timecores and in the MB timecore, showing relationships inferred in a parent network based on presence/absence of taxa in multiple environments. We show with continuous lines those relations that have been identified as significant aggregations in the parent network, and with dotted lines the significant segregations. Relations are color-coded according to whether or not they are present in the maternal MB timecore and, for the relationships that are present at MB, according to the first timepoint in which they appeared. Relations that are not observed in the MB timecore are shown in grey; relations present only in MB are colored brown; relations appearing at I5 are colored orange; relations appearing at I4 are purple; relations appearing at I3 are green; relations appearing at I2 are blue; and relations appearing at I1 are red. Nodes are additionally colored according to their dominant environment in the original classification of Tamames et al. . A dominant environment was assigned for a given genus when more than half of the samples where it was detected belonged to that environment. Red: host environments; Green: terrestrial environments; White: no particular preference for any environment (i.e., cosmopolitan taxa). The thickness of the network edges represents the significance of the association (z-score).

Similar articles

  • Metal availability shapes early life microbial ecology and community succession.
    Soto Ocaña J, Friedman ES, Keenan O, Bayard NU, Ford E, Tanes C, Munneke MJ, Beavers WN, Skaar EP, Bittinger K, Zemel BS, Wu GD, Zackular JP. Soto Ocaña J, et al. mBio. 2024 Nov 13;15(11):e0153424. doi: 10.1128/mbio.01534-24. Epub 2024 Oct 23. mBio. 2024. PMID: 39440978 Free PMC article.
  • Succession of microbial consortia in the developing infant gut microbiome.
    Koenig JE, Spor A, Scalfone N, Fricker AD, Stombaugh J, Knight R, Angenent LT, Ley RE. Koenig JE, et al. Proc Natl Acad Sci U S A. 2011 Mar 15;108 Suppl 1(Suppl 1):4578-85. doi: 10.1073/pnas.1000081107. Epub 2010 Jul 28. Proc Natl Acad Sci U S A. 2011. PMID: 20668239 Free PMC article.
  • Successional Stages in Infant Gut Microbiota Maturation.
    Beller L, Deboutte W, Falony G, Vieira-Silva S, Tito RY, Valles-Colomer M, Rymenans L, Jansen D, Van Espen L, Papadaki MI, Shi C, Yinda CK, Zeller M, Faust K, Van Ranst M, Raes J, Matthijnssens J. Beller L, et al. mBio. 2021 Dec 21;12(6):e0185721. doi: 10.1128/mBio.01857-21. Epub 2021 Dec 14. mBio. 2021. PMID: 34903050 Free PMC article.
  • Nutrition, Gut Microbiota, and Allergy Development in Infants.
    Rey-Mariño A, Francino MP. Rey-Mariño A, et al. Nutrients. 2022 Oct 15;14(20):4316. doi: 10.3390/nu14204316. Nutrients. 2022. PMID: 36297000 Free PMC article. Review.
  • Metagenomic surveys of gut microbiota.
    Mandal RS, Saha S, Das S. Mandal RS, et al. Genomics Proteomics Bioinformatics. 2015 Jun;13(3):148-58. doi: 10.1016/j.gpb.2015.02.005. Epub 2015 Jul 13. Genomics Proteomics Bioinformatics. 2015. PMID: 26184859 Free PMC article. Review.

Cited by

References

    1. Sekirov I, Russell SL, Antunes LC, Finlay BB (2010) Gut microbiota in health and disease. Physiol Rev 90: 859–904. - PubMed
    1. Collado MC, D'Auria G, Mira A, Francino MP (2013) Human Microbiome and Diseases: A Metagenomic Approach. In: Watson RR and Preedy VR, editors. Bioactive Food as Dietary Interventions for Liver and Gastrointestinal Disease. San Diego: Academic Press. pp. 235–249.
    1. Baas-Becking L (1934) Geobiologie of inleiding tot de milieukunde. Van Stockum & Zoon. 263 p.
    1. de Wit R, Bouvier T (2006) ‘Everything is everywhere, but, the environment selects’; what did Baas Becking and Beijerinck really say? Environ Microbiol 8: 755–758. - PubMed
    1. McConnell EL, Basit AW, Murdan S (2008) Measurements of rat and mouse gastrointestinal pH, fluid and lymphoid tissue, and implications for in-vivo experiments. J Pharm Pharmacol 60: 63–70. - PubMed

Publication types