. 2014 Jun 5:3:e03100.
doi: 10.7554/eLife.03100.

Salmonella Typhi and Salmonella Paratyphi A elaborate distinct systemic metabolite signatures during enteric fever

Affiliations

Salmonella Typhi and Salmonella Paratyphi A elaborate distinct systemic metabolite signatures during enteric fever

Elin Näsström et al. Elife. .

Abstract

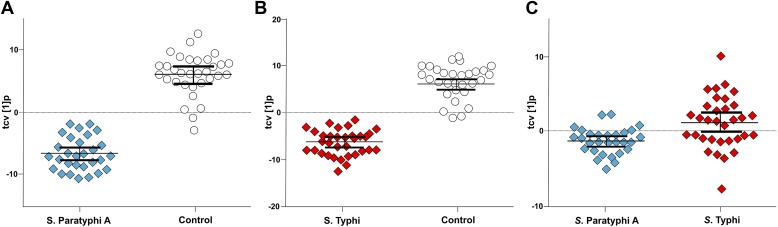
The host-pathogen interactions induced by Salmonella Typhi and Salmonella Paratyphi A during enteric fever are poorly understood. This knowledge gap, and the human restricted nature of these bacteria, limit our understanding of the disease and impede the development of new diagnostic approaches. To investigate metabolite signals associated with enteric fever we performed two dimensional gas chromatography with time-of-flight mass spectrometry (GCxGC/TOFMS) on plasma from patients with S. Typhi and S. Paratyphi A infections and asymptomatic controls, identifying 695 individual metabolite peaks. Applying supervised pattern recognition, we found highly significant and reproducible metabolite profiles separating S. Typhi cases, S. Paratyphi A cases, and controls, calculating that a combination of six metabolites could accurately define the etiological agent. For the first time we show that reproducible and serovar specific systemic biomarkers can be detected during enteric fever. Our work defines several biologically plausible metabolites that can be used to detect enteric fever, and unlocks the potential of this method in diagnosing other systemic bacterial infections.

Keywords: Salmonella Paratyphi A; Salmonella Typhi; enteric fever; epidemiology; global health; human; infectious disease; mass spectrometry; metabolites; microbiology; typhoid.


Conflict of interest statement

The authors declare that no competing interests exist.

Figures

Figure 1.
Figure 1.. A two-dimensional gas chromatogram mass spectrum of a plasma sample from a patient with enteric fever.
Image shows a two-dimensional ion chromatogram of unprocessed GCxGC/TOFMS data of a plasma sample from a patient with enteric fever. The three-dimensional landscape depicts detected metabolites peaks in the first dimension (seconds–x axis), the second dimension (seconds–y axis), and the concentration intensity of the peak signal (z axis). DOI: http://dx.doi.org/10.7554/eLife.03100.003
Figure 2.
Figure 2.. Modeling the variation in the GCxGC/TOFMS data in plasma samples from enteric fever patients and controls.
(A) PCA plot of the first two principal components (t[2] vs t[1]). The PCA plot outlines a separation between the control plasma samples (N = 32; including 7 analytical replicates) and the plasma samples from enteric fever cases (S. Typhi; N = 33 - including 8 analytical replicates, and S. Paratyphi A; N = 29–including 4 analytical replicates). PCA model incorporates 695 metabolites with eight significant principal components (R2X = 0.437, Q2 = 0.255). (B) OPLS-DA scores plot of the two predictive components (tp[2] vs tp[1]; x axis and y axis, respectively) outlining a separation between the control plasma samples (N = 32; including 7 analytical replicates) and the plasma samples from enteric fever cases (S. Typhi; N = 33 - including 8 analytical replicates, and S. Paratyphi A; N = 29 - including 4 analytical replicates). OPLS-DA model includes 695 metabolites with two predictive and two orthogonal components (R2X = 0.269, R2Y = 0.837, Q2 = 0.451, p=1.7 × 10⁻⁶ [CV-ANOVA]). DOI: http://dx.doi.org/10.7554/eLife.03100.004
Figure 3.
Figure 3.. Pairwise OPLS-DA models of GCxGC/TOFMS data in plasma samples from controls, S. Typhi cases, and S. Paratyphi A cases.
Cross-validated OPLS-DA scores plots of the first predictive component (tcv[1]p) showing the separation between; (A) Controls (N = 32, including 7 analytical replicates) and S. Paratyphi A cases (N = 29, including 4 analytical replicates) (p=4.2 × 10⁻¹⁸). (B) Controls and S. Typhi cases (N = 33, including 8 analytical replicates) (p=4.1 × 10⁻²⁰). (C) S. Typhi cases and S. Paratyphi A cases (p=6.7 × 10⁻²). Error bars represent mean score values with 95% confidence intervals. The OPLS-DA model is based on 695 metabolites with one predictive and two orthogonal (A and B), or one predictive and one orthogonal (C) component(s). Additional model information is shown in Table 1. DOI: http://dx.doi.org/10.7554/eLife.03100.006
Figure 4.
Figure 4.. Verification of metabolite signals in plasma samples from a control and patients with S. Typhi and S. Paratyphi A infections.
Three metabolites, in three samples from each sample group that were statistically significant in differentiating between sample classes using pattern recognition modelling, were selected for confirmation using unprocessed chromatographic data. (A) OPLS-DA scores plot (tp[2] vs tp[1]) highlighting the three selected samples (S. Typhi: 45, S. Paratyphi A: 19, and control: 60). Panel BD show one dimensional chromatographic peaks representing each metabolite from the three unprocessed plasma samples (coloured by sample group). Second dimension retention times (s) are shown along the x-axes and the peak intensities along the y-axes. (B) Phenylalanine (mass: 218, 1st retention time: 1785 s). (C) Pipecolic acid (mass: 156, 1st retention time: 1130 s). (D) 2-phenyl-2-hydroxybutanioc acid (mass: 193, 1st retention time: 1725 s). Panel EM show the corresponding two dimensional chromatographic peaks with one peak for each sample and metabolite. First and second dimension retention times (s) are shown along the x and y-axes, respectively, and the peak area is shown along the z-axes. The peaks are coloured according to area (colour scale is shown to the right) and the top colour for the two lowest peaks for each metabolite is determined according to the colour scale of the highest peak for the same metabolite. (E, H, K) Phenylalanine for sample 45, 19, and 60, respectively. (F, I, L) Pipecolic acid for sample 19, 4, 5 and 60, respectively. (G, J, M) 2-phenyl-2-hydroxybutanioc acid for sample 45, 19, and 60, respectively. DOI: http://dx.doi.org/10.7554/eLife.03100.008
Figure 5.
Figure 5.. The discriminatory power of 46 metabolites to distinguish between plasma samples from controls, S. Typhi cases, and S. Paratyphi A cases.
Panels on the left show the ROC-curves based on scores (red lines) and cross-validated scores (black lines) from OPLS-DA models using the 46 most statistically significant (S. Typhi against controls and/or S. Paratyphi A against controls) metabolites separating enteric fever samples from control samples and separating S. Typhi samples from S. Paratyphi A samples. The ROC curve showing the best individual discriminating metabolite is shown by the grey line. The scatterplots show pairwise class differences based on scores (t[1]p) (left), cross-validated scores (tcv[1]p) (centre) from OPLS-DA models using the 46 most statistically significant metabolites (as above), and the relative concentration of the best individual discriminating metabolite (right). Data presented for; (A) S. Paratyphi A vs Controls, (AUC scores: 1.0, AUC CV scores: 0.999, AUC best metabolite: 0.884). (B) S. Typhi vs Controls (AUC scores: 1.0, AUC CV scores: 0.996, AUC best metabolite: 0.925). (C) S. Paratyphi A vs S. Typhi (AUC scores: 0.951, AUC CV scores: 0.898, AUC best metabolite: 0.693. Error bars represent mean score values with 95% confidence intervals. DOI: http://dx.doi.org/10.7554/eLife.03100.009
Figure 6.
Figure 6.. The discriminatory power of six metabolites to distinguish between plasma samples from controls, S. Typhi cases, and S. Paratyphi A cases.
The panels on the left show the ROC-curves based on scores (red lines) and cross-validated scores (black lines) from OPLS-DA models using the six most statistically significant (S. Typhi against controls and/or S. Paratyphi A against controls) metabolites separating enteric fever samples from control samples and separating S. Typhi samples from S. Paratyphi A samples. The scatterplots show pairwise class differences based on scores (t[1]p) (left), cross-validated scores (tcv[1]p) (right) from OPLS-DA models using the 6 most statistically significant metabolites (as above). Data presented for; (A) S. Paratyphi A vs Controls, (AUC scores: 0.964, AUC CV scores: 0.948). (B) S. Typhi vs Controls (AUC scores: 0.934, AUC CV scores: 0.923) and (C) S. Paratyphi A vs S. Typhi (AUC scores: 0.801, AUC CV scores: 0.796). Error bars represent mean score values with 95% confidence intervals. DOI: http://dx.doi.org/10.7554/eLife.03100.010

Comment in

  • Honing in on enteric fever.
    McKinnon LR, Abdool Karim Q. McKinnon LR, et al. Elife. 2014 Jul 1;3:e03545. doi: 10.7554/eLife.03545. Elife. 2014. PMID: 24986861 Free PMC article.

References

    1. Antti H, Fahlgren A, Näsström E, Kouremenos K, Sundén-Cullberg J, Guo Y, Moritz T, Wolf-Watz H, Johansson A, Fallman M. 2013. Metabolic profiling for detection of Staphylococcus aureus infection and antibiotic resistance. PLOS ONE 8:e56971. doi: 10.1371/journal.pone.0056971 - DOI - PMC - PubMed
    1. Arjyal A, Basnyat B, Koirala S, Karkey A, Dongol S, Agrawaal KK, Shakya N, Shrestha K, Sharma M, Lama S, Shrestha K, Khatri NS, Shrestha U, Campbell JI, Baker S, Farrar J, Wolbers M, Dolecek C. 2011. Gatifloxacin versus chloramphenicol for uncomplicated enteric fever: an open-label, randomised, controlled trial. The Lancet Infectious Diseases 11:445–454. doi: 10.1016/S1473-3099(11)70089-5 - DOI - PMC - PubMed
    1. Baker S, Favorov M, Dougan G. 2010. Searching for the elusive typhoid diagnostic. BMC Infectious Diseases 10:45. doi: 10.1186/1471-2334-10-45 - DOI - PMC - PubMed
    1. Baker S, Holt KE, Clements AC, Karkey A, Arjyal A, Boni MF, Dongol S, Hammond N, Koirala S, Duy PT, Nga TV, Campbell JI, Dolecek C, Basnyat B, Dougan G, Farrar JJ. 2011. Combined high-resolution genotyping and geospatial analysis reveals modes of endemic urban typhoid fever transmission. Open Biology 1:110008. doi: 10.1098/rsob.110008 - DOI - PMC - PubMed
    1. Baumgarner BL, Cooper BR. 2012. Evaluation of a tandem gas chromatography/time-of-flight mass spectrometry metabolomics platform as a single method to investigate the effect of starvation on whole-animal metabolism in rainbow trout (Oncorhynchus mykiss). The Journal of Experimental Biology 215:1627–1632 - PubMed

Publication types

MeSH terms