. 2014 Jul;2(7):643-54.
doi: 10.1158/2326-6066.CIR-13-0215. Epub 2014 Apr 29.

Response to BRAF inhibition in melanoma is enhanced when combined with immune checkpoint blockade

Affiliations

Response to BRAF inhibition in melanoma is enhanced when combined with immune checkpoint blockade

Zachary A Cooper et al. Cancer Immunol Res. 2014 Jul.

Abstract

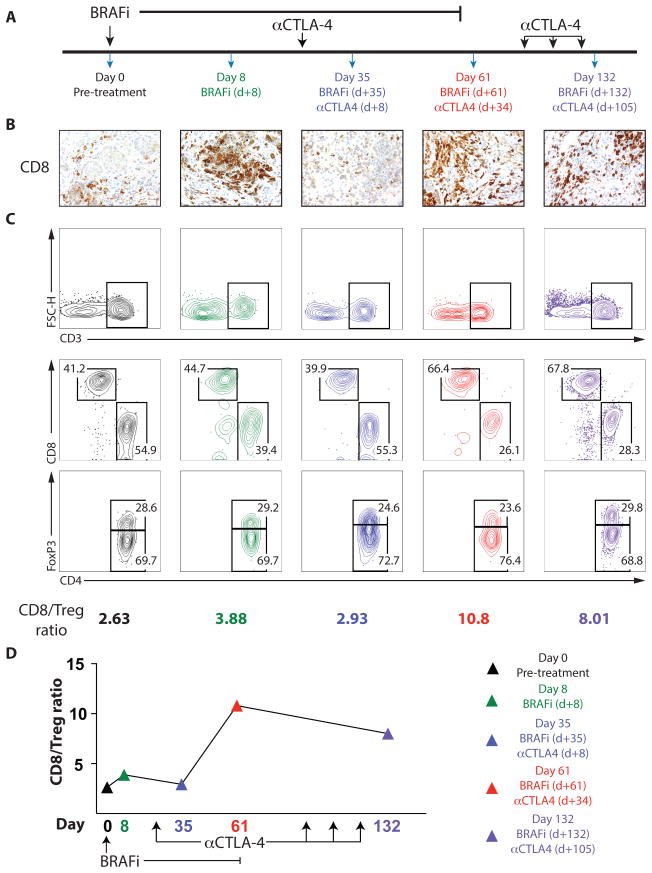
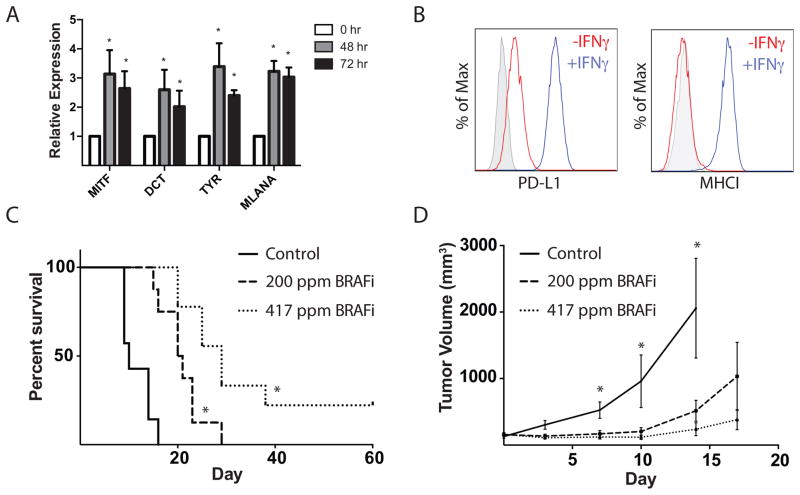
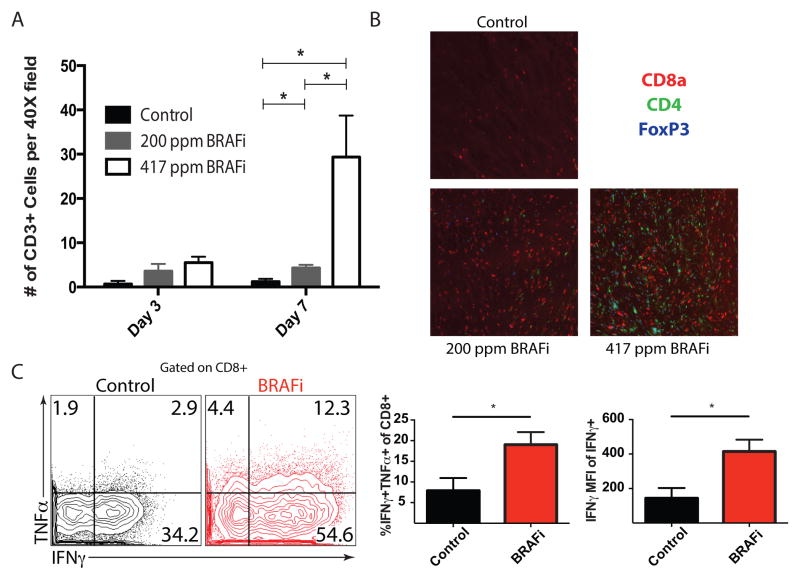
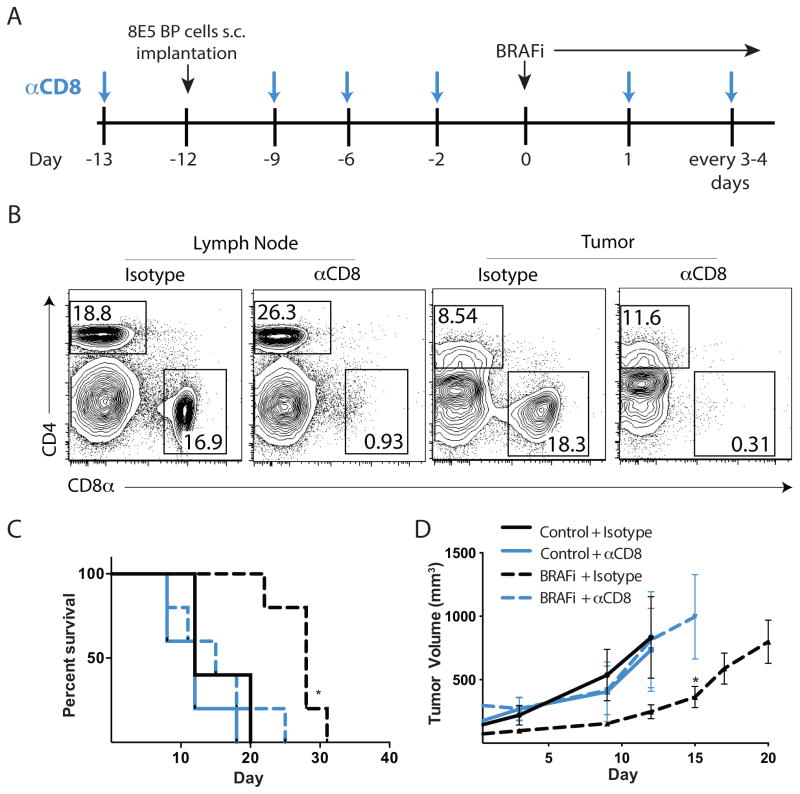
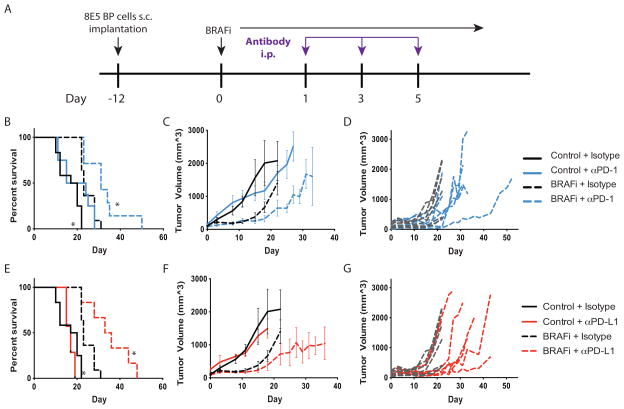
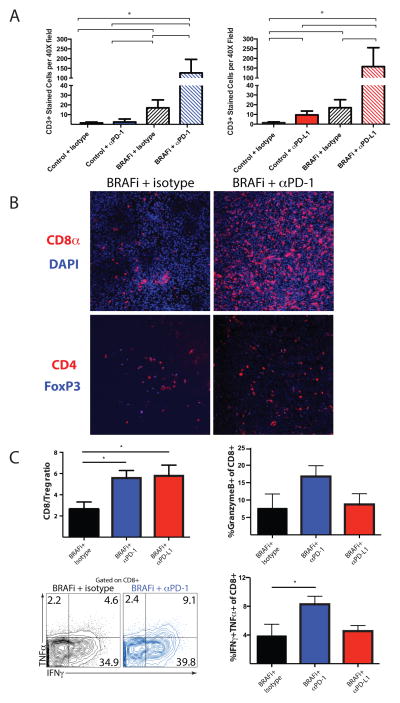
BRAF-targeted therapy results in objective responses in the majority of patients; however, the responses are short lived (∼6 months). In contrast, treatment with immune checkpoint inhibitors results in a lower response rate, but the responses tend to be more durable. BRAF inhibition results in a more favorable tumor microenvironment in patients, with an increase in CD8(+) T-cell infiltrate and a decrease in immunosuppressive cytokines. There is also increased expression of the immunomodulatory molecule PDL1, which may contribute to the resistance. On the basis of these findings, we hypothesized that BRAF-targeted therapy may synergize with the PD1 pathway blockade to enhance antitumor immunity. To test this hypothesis, we developed a BRAF(V600E)/Pten(-/-) syngeneic tumor graft immunocompetent mouse model in which BRAF inhibition leads to a significant increase in the intratumoral CD8(+) T-cell density and cytokine production, similar to the effects of BRAF inhibition in patients. In this model, CD8(+) T cells were found to play a critical role in the therapeutic effect of BRAF inhibition. Administration of anti-PD1 or anti-PDL1 together with a BRAF inhibitor led to an enhanced response, significantly prolonging survival and slowing tumor growth, as well as significantly increasing the number and activity of tumor-infiltrating lymphocytes. These results demonstrate synergy between combined BRAF-targeted therapy and immune checkpoint blockade. Although clinical trials combining these two strategies are ongoing, important questions still remain unanswered. Further studies using this new melanoma mouse model may provide therapeutic insights, including optimal timing and sequence of therapy.


Conflict of interest statement

Disclosure of Potential Conflicts of Interest

A. Sharpe has licensed patents and received patent royalties from Genentech and CoStim Pharmaceuticals. G. Freeman has patents on the PD-1 pathway from Bristol-Myers-Squibb, Genentech, Merck, EMD-Serrono, Boehringer-Ingelheim, Amplimmune, and CoStim. F. S. Hodi has served as a non-paid consultant to Genentech/Roche, Merck, and Bristol-Myers Squibb and received clinical trial support from Genentech, Merck, and Bristol-Myers Squibb. K. Flaherty has served as a consultant to GlaxoSmithKline and Genentech/Roche.

Figures

Figure 1
Figure 1. Combined BRAF inhibitor and anti-CTLA-4 administration leads to prolonged antitumor immunity in a patient with metastatic melanoma
A patient with metastatic melanoma was treated with combined BRAF-targeted therapy plus CTLA-4 blockade. A, Timeline showing treatment schedule and biopsies B, CD8+ T-cell infiltrate was determined by IHC (40x magnification). C and D, Immune cells isolated from tumors were analyzed by flow cytometry. (C, Top) CD3+ lymphocytes. FSC-H, forward scatter height. (C, Middle) Populations of CD4+ and CD8+ lymphocytes pregated on CD3+ cells. (C, Bottom) Percentage of CD4+FoxP3+ T regulatory cells (Treg) and CD4+FoxP3 non-Tregs, pregated on CD3+CD4+ T cells. The ratio of CD8+ T cells to CD4+FoxP3+ Treg cells is shown (C) and plotted versus time (D).
Figure 2
Figure 2. BRAF inhibition results in a dose-dependent increase in survival and a slowing of tumor growth in a syngeneic implantable tumor model
A, Comparison of expression of DCT, TYR, MLANA and MITF melanoma antigen mRNA (relative to 18S RNA) in the BRAFV600E/Pten−/−, or BP, cell line that was cultured with 2μM of BRAFi for 0, 48 or 72hrs. B, Comparison of surface expression of PD-L1 and MHC class I (MHCI) on BP cells cultured with (red) or without (blue) IFNγ for 24 hours. Gray indicates unstained cells. C, 8×10⁵ BP cells were implanted subcutaneously in C57BL/6. When tumors reached ~100mm3, BRAFi was administered at 200 or 417 ppm (day 0). Survival is shown in a Kaplan-Meier plot. Mice were sacrificed when tumors reached a maximum diameter of 2cm or had ulceration (n≥7). *, p< 0.05 comparing BRAFi-treated mice to control mice. D, Tumor growth curves for experiments as in (C). Tumor volumes were measured every 3–4 days (n≥10). *, p< 0.05 comparing BRAFi-treated mice to control mice.
Figure 3
Figure 3. BRAF inhibition is associated with an increase in cytokine production and density of tumor-infiltrating T cells
A, Subcutaneously implanted BP tumors were harvested 3 or 7 days after BRAFi initiation. CD3 expression was assayed via IHC in 3 randomly selected intratumoral 40X fields by a dermatopathologist. n=3, p<0.05. B, OCT-embedded BP tumors (harvested 7 days after BRAFi initiation) were stained for CD8a, CD4, and FoxP3. Representative fields are shown (200X magnification). C, Expression of IFNγ and TNFα by intratumoral immune-cell infiltrates stimulated ex vivo with PMA/ionomycin, was assayed via flow cytometry. Plots are pre-gated on CD3+CD8+ T cells (left). Average percentage of IFNγ+TNFα+ T cells (of CD3+CD8+ cells) and mean fluorescence intensity (MFI) of IFNγ on IFNγ+CD8+ T cells are shown (n=5 per group).
Figure 4
Figure 4. CD8 T cells play a critical role in responses of tumor-infiltrating lymphocytes due to BRAF inhibition
A, Schema for CD8 T cell-depletion in BP tumors. 8×10⁵ BP cells were s.c. injected into C57BL/6 mice and BRAFi administration (200 ppm) was initiated at day 0. 200μg of rat anti-mouse CD8, or isotype antibody was administered i.p. 1 day before tumor implantation and every 3–4 days thereafter. B, Analysis of CD4+ and CD8+ T cells in the draining lymph node and tumor were evaluated on days 3, 7 and 11 after the initiation of BRAFi for CD8 T cell depletion by flow cytometry using a different anti-CD8 clone. Representative plots at day 3 are shown. C, Effects of CD8 depletion on survival of mice given BP tumor with or without BRAFi therapy displayed in a Kaplan-Meier plot. *, p< 0.05 comparing BRAFi treated mice to control mice. D, Tumor volumes from experiments as in (C) measured every 3–4 days. *, p< 0.05 comparing BRAFi + isotype treated mice to BRAFi + anti-CD8 mAb-treated mice. Representative of 3 experiments.
Figure 5
Figure 5. PD-1 or PD-L1 blockade synergizes with BRAF inhibition to slow tumor growth and increase survival
A, Schema for combination treatment using PD-1/PD-L1 blockade and BRAFi after BP cell implantation. 8×10⁵ BP cells were given to C57BL/6 mice s.c., and BRAFi (200 ppm) was initiated at day 0. 100μg of anti-PD-1 (29F.1A12), 200μg anti-PD-L1 (10F.9G2), or isotype antibody was administered i.p. at days 1, 3, and 5. B–D, Effects of combined BRAFi and anti-PD-1 on the survival and tumor volumes in mice given BP tumor cells. Kaplan-Meier plot showing survival after BRAFi and anti-PD-1 combined treatment averaged for all mice in each treatment group (B). Tumor volumes (measured every 3–4 days) are averaged (C) and shown for individual mice for BRAFi plus isotype control versus BRAFi + anti-PD-1 (D). E–G, Effects of combined BRAFi and anti-PD-L1 on the survival of mice given BP tumor cells. Kaplan-Meier plot showing survival after BRAFi and anti-PD-L1 combined treatment averaged for all mice in each treatment group (E). Tumor volumes (measured every 3–4 days) are averaged (F) and shown for individual mice for BRAFi + isotype control versus BRAFi plus anti-PD-L1 (G). For the Kaplan-Meier plot, control + isotype (n=12), BRAFi + isotype (n=11), control + anti-PD-1 (n=8) or anti-PD-L1 (n=7) or BRAFi + anti-PD-1 (n=7) or anti-PD-L1 (n=6). *, p< 0.05 compared to BRAFi + isotype mice. Tumor volumes are representative of 3 experiments (n>6).
Figure 6
Figure 6. PD-1 pathway blockade and BRAF inhibition synergize to enhance number and function of tumor-infiltrating T cells
Experiment was performed as in Figure 5. A, CD3+ T cells were assayed via IHC in tumors of mice given BRAFi plus anti-PD-1, anti-PD-L1 or control mAb. n≧ 3, p< 0.05. B, CD4+, CD8+ and FoxP3+ expression was assayed via immunofluorescence (IF) within tumors of mice given BRAFi plus anti-PD-1 or isotype control mAb. Representative sections are shown (200X magnification). C, Immune infiltrates in tumors harvested 14 days after BRAFi initiation were characterized by flow cytometry. The ratios of CD8+ T cells to Tregs (CD4+FoxP3+) are shown, as are percentage of CD8+ T cells that are positive for Granzyme B or for IFNγ and TNFα. Representative flow plots for IFNγ and TNFα expression in CD8+ T cells are shown.

References

    1. Flaherty KT, Puzanov I, Kim KB, Ribas A, McArthur GA, Sosman JA, et al. Inhibition of mutated, activated BRAF in metastatic melanoma. The New England journal of medicine. 2010;363:809–19. - PMC - PubMed
    1. Sosman JA, Kim KB, Schuchter L, Gonzalez R, Pavlick AC, Weber JS, et al. Survival in BRAF V600-mutant advanced melanoma treated with vemurafenib. The New England journal of medicine. 2012;366:707–14. - PMC - PubMed
    1. Chapman PB, Hauschild A, Robert C, Haanen JB, Ascierto P, Larkin J, et al. Improved survival with vemurafenib in melanoma with BRAF V600E mutation. The New England journal of medicine. 2011;364:2507–16. - PMC - PubMed
    1. Flaherty KT, Infante JR, Daud A, Gonzalez R, Kefford RF, Sosman J, et al. Combined BRAF and MEK Inhibition in Melanoma with BRAF V600 Mutations. The New England journal of medicine. 2012;367:1694–703. - PMC - PubMed
    1. Hodi FS, O’Day SJ, McDermott DF, Weber RW, Sosman JA, Haanen JB, et al. Improved survival with ipilimumab in patients with metastatic melanoma. The New England journal of medicine. 2010;363:711–23. - PMC - PubMed

Publication types

MeSH terms