

Population pharmacokinetics of imipenem in critically ill patients with suspected ventilator-associated pneumonia and evaluation of dosage regimens
- PMID: 24903189
- PMCID: PMC4243876
- DOI: 10.1111/bcp.12435
Population pharmacokinetics of imipenem in critically ill patients with suspected ventilator-associated pneumonia and evaluation of dosage regimens
Abstract
Aims: Significant alterations in the pharmacokinetics (PK) of antimicrobials have been reported in critically ill patients. We describe PK parameters of imipenem in intensive care unit (ICU) patients with suspected ventilator-associated pneumonia and evaluate several dosage regimens.
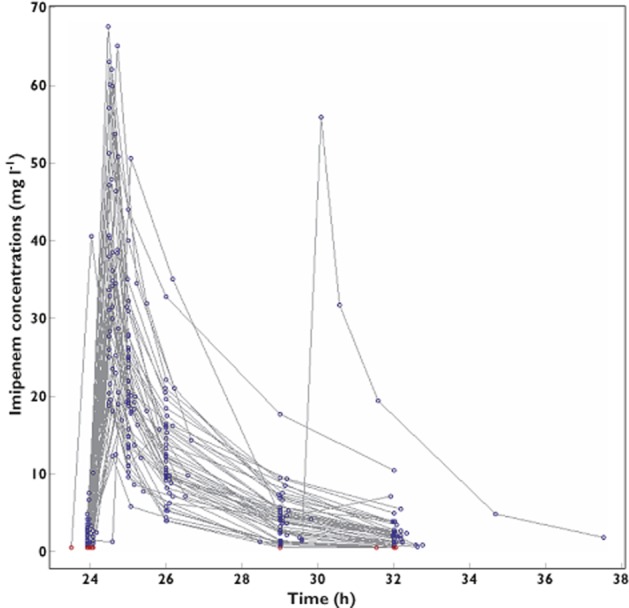
Methods: This French multicentre, prospective, open-label study was conducted in ICU patients with a presumptive diagnosis of ventilator-associated pneumonia caused by Gram-negative bacilli, who empirically received imipenem intravenously every 8 h. Plasma imipenem concentrations were measured during the fourth imipenem infusion using six samples (trough, 0.5, 1, 2, 5 and 8 h). Data were analysed with a population approach using the stochastic approximation expectation maximization algorithm in Monolix 4.2. A Monte Carlo simulation was performed to evaluate the following six dosage regimens: 500, 750 or 1000 mg with administration every 6 or 8 h. The pharmacodynamic target was defined as the probability of achieving a fractional time above the minimal inhibitory concentration (MIC) of >40%.
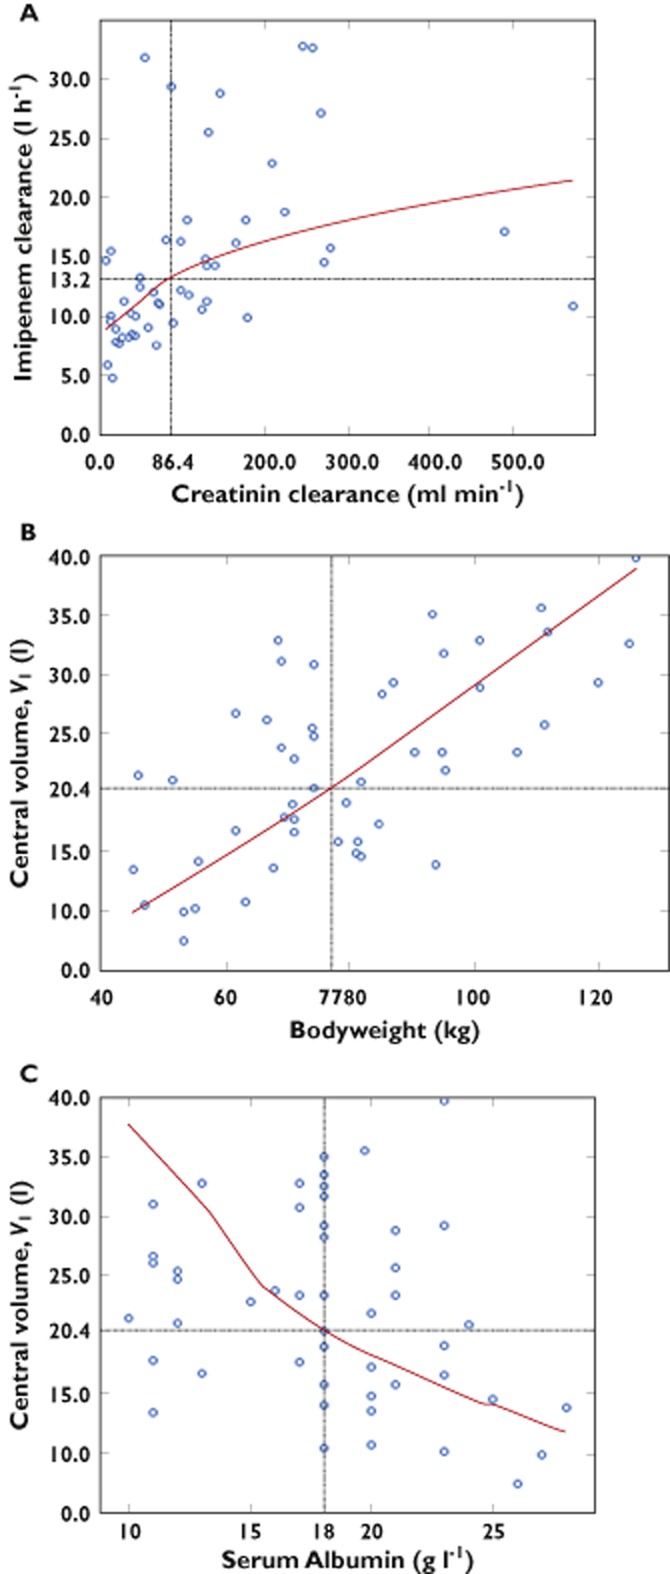
Results: Fifty-one patients were included in the PK analysis. Imipenem concentration data were best described by a two-compartment model with three covariates (creatinine clearance, total bodyweight and serum albumin). Estimated clearance (between-subject variability) was 13.2 l h(-1) (38%) and estimated central volume 20.4 l (31%). At an MIC of 4 μg ml(-1) , the probability of achieving 40% fractional time > MIC was 91.8% for 0.5 h infusions of 750 mg every 6 h, 86.0% for 1000 mg every 8 h and 96.9% for 1000 mg every 6 h.
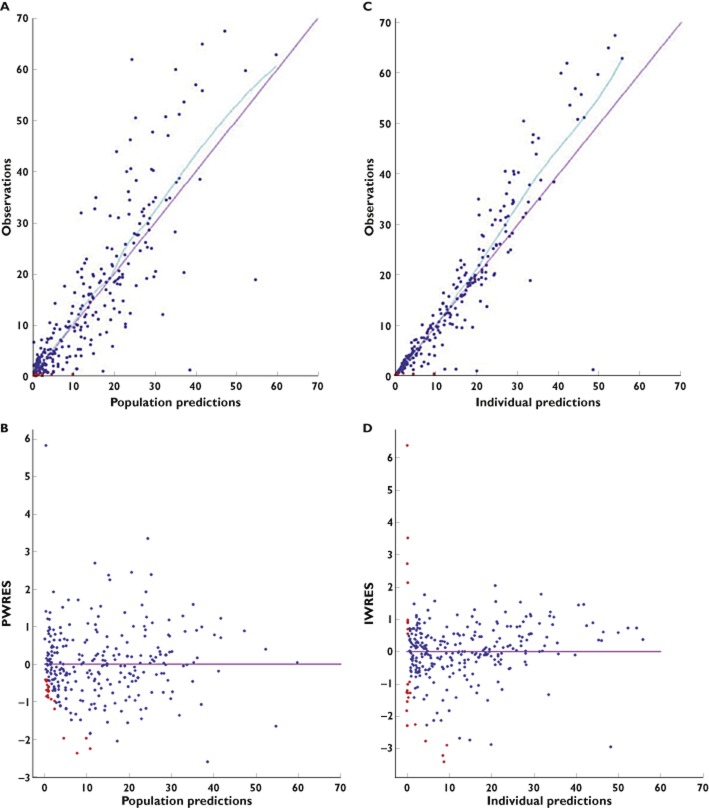
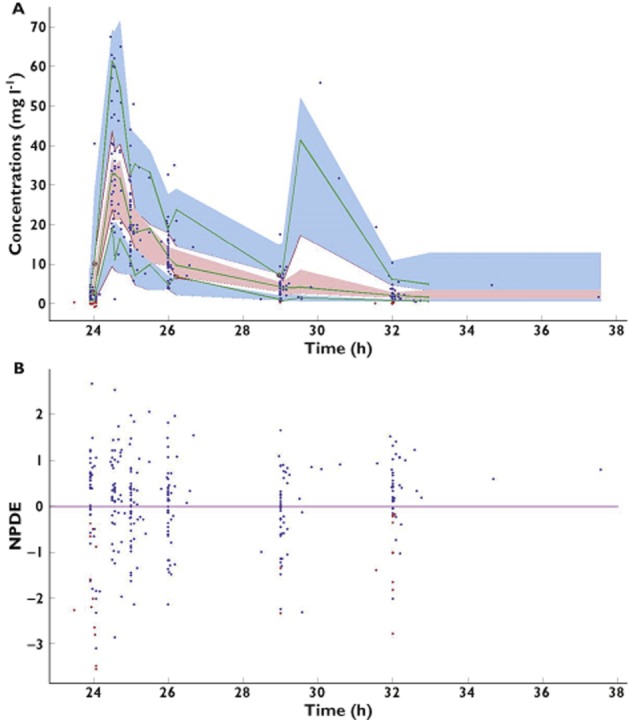
Conclusions: This population PK model accurately estimated imipenem concentrations in ICU patients. The simulation showed that for these patients, the best dosage regimen of imipenem is 750 mg every 6 h and not 1000 mg every 8 h.
Trial registration: ClinicalTrials.gov NCT00950222.
Keywords: critical care; imipenem; population pharmacokinetics; ventilator-associated pneumonia.
© 2014 The British Pharmacological Society.
Figures
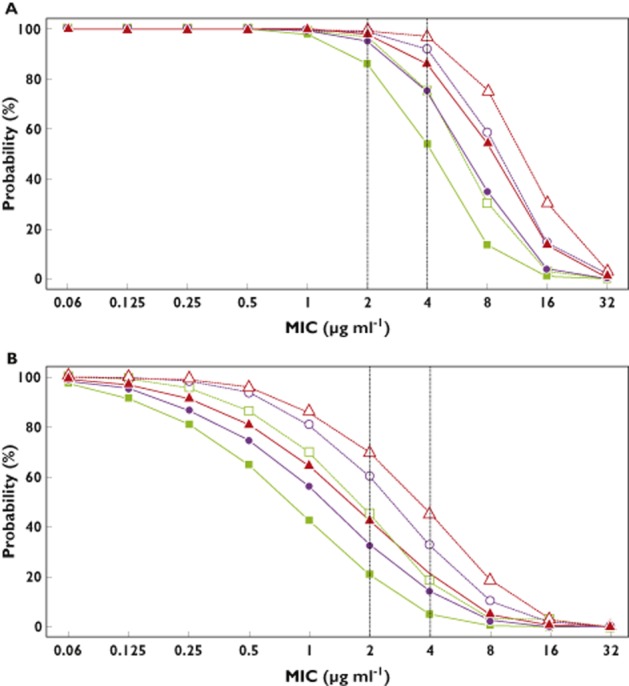
 , 500 mg every 8 h (q8h);
  , 500 mg every 6 h (q6h);
  , 750 mg q8h;
  , 750 mg q6h;
  , 1000 mg q8h;
  , 1000 mg q6h
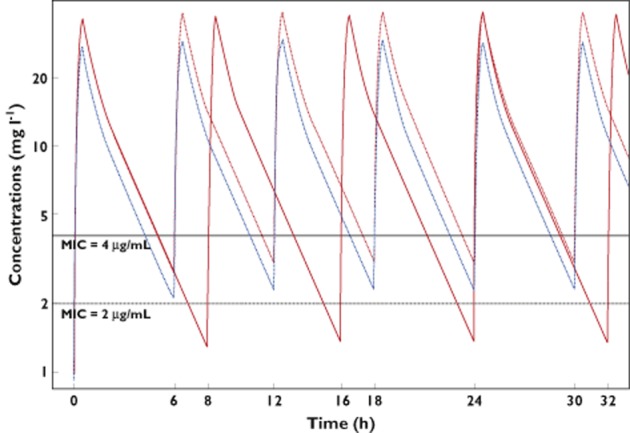
 ) or 1000 mg q6h (
 ) or 750 mg q6h (
 )
)References
-
- American Thoracic Society, Infectious Diseases Society of America. Guidelines for the management of adults with hospital-acquired, ventilator-associated, and healthcare-associated pneumonia. Am J Respir Crit Care Med. 2005;171:388–416. - PubMed
-
- Joseph J, Rodvold KA. The role of carbapenems in the treatment of severe nosocomial respiratory tract infections. Expert Opin Pharmacother. 2008;9:561–575. - PubMed
-
- Balfour JA, Bryson HM, Brogden RN. Imipenem/cilastatin: an update of its antibacterial activity, pharmacokinetics and therapeutic efficacy in the treatment of serious infections. Drugs. 1996;51:99–136. - PubMed
-
- Wolff M, Joly-Guillou M, Pajot O. Les carbapénèmes. Réanimation. 2009;18(Suppl. 2):S199–208.
-
- Lee LS, Kinzig-Schippers M, Nafziger AN, Ma L, Sörgel F, Jones RN, Drusano GL, Bertino JS. Comparison of 30-min and 3-h infusion regimens for imipenem/cilastatin and for meropenem evaluated by Monte Carlo simulation. Diagn Microbiol Infect Dis. 2010;68:251–258. - PubMed
Publication types
MeSH terms
Substances
Associated data
LinkOut - more resources
Full Text Sources
Other Literature Sources
Medical
