. 2014 Jun 6;344(6188):1173-8.
doi: 10.1126/science.1249098.

Sleep promotes branch-specific formation of dendritic spines after learning

Affiliations

Sleep promotes branch-specific formation of dendritic spines after learning

Guang Yang et al. Science. .

Abstract

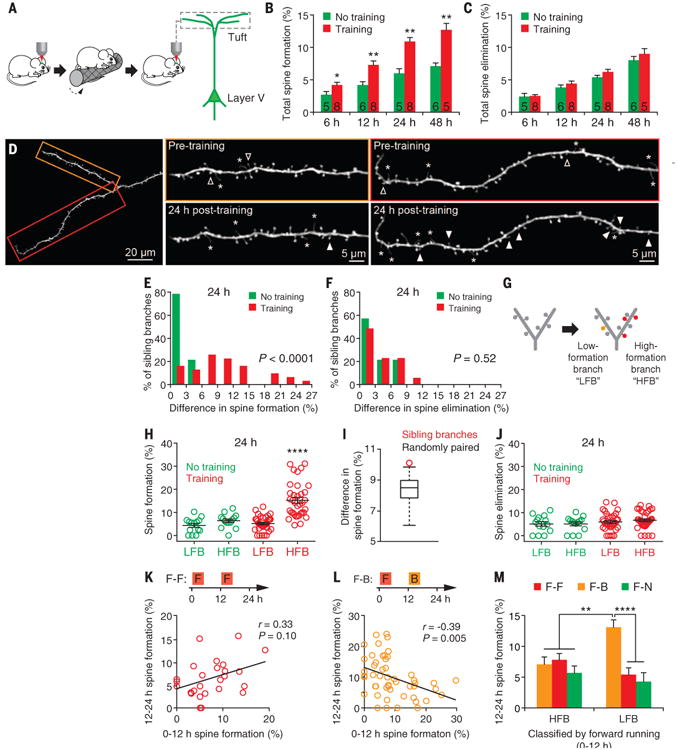
How sleep helps learning and memory remains unknown. We report in mouse motor cortex that sleep after motor learning promotes the formation of postsynaptic dendritic spines on a subset of branches of individual layer V pyramidal neurons. New spines are formed on different sets of dendritic branches in response to different learning tasks and are protected from being eliminated when multiple tasks are learned. Neurons activated during learning of a motor task are reactivated during subsequent non-rapid eye movement sleep, and disrupting this neuronal reactivation prevents branch-specific spine formation. These findings indicate that sleep has a key role in promoting learning-dependent synapse formation and maintenance on selected dendritic branches, which contribute to memory storage.


Figures

Fig. 1
Fig. 1. Motor learning induces branch-specific spine formation
(A) Transcranial two-photon imaging in the primary motor cortex of awake, head-restrained mice before and after rotarod motor training. (B and C) The percentage of dendritic spines formed (B) and eliminated (C) over time after one session of rotarod training (20 trials). Motor training progressively increased new spine formation over the course of 6 to 48 hours. No significant difference in the rate of spine elimination was observed within 48 hours after training. The number of animals is indicated on each column. (D) An example of two sibling apical tuft branches with different degrees of spine formation 24 hours after training. Filled arrowheads indicate newly formed dendritic spines and open ones indicate eliminated spines over a 24-hour interval. Asterisks indicate dendritic filopodia. (E) Motor training–induced spine formation was significantly different between sibling branches (15 trained mice and 8 control mice). (F) No significant difference in spine elimination between sibling branches. (G) Classification of sibling dendritic branches to HFBs and LFBs on the basis of the spine formation rate relative to each other. (H) Motor training significantly increased the rate of spine formation on HFBs 24 hours after training. (I) The average of measured difference in spine formation between HFBs and LFBs was statistically larger (P < 0.0001) for sibling branches (red circle) than for randomly paired branches (box plot of results from 100 simulations of random pairing). The simulation was performed to test the null hypothesis that learning-induced spine changes are distributed randomly across all branches. (J) There was no significant difference in spine elimination between HFBs and LFBs 24 hours after training. (K and L) Mice were first trained to run forward on an accelerating rotarod and, 12 hours later, to run either forward (F-F) or backward (F-B). Correlation of spine formation rate on individual branches between 0–12 hours and 12–24 hours. The correlation was positive when animals were subjected to the same forward training [(K) n = 6 mice] and negative when the animals were trained with a backward running task [(L) n = 8 mice]. (M) Experimental designs are shown in (K) and (L). Sibling branches were classified as HFBs and LFBs on the basis of the degree of spine formation induced by the initial forward training from 0 to 12 hours. There is a significant increase in spine formation on LFBs than on HFBs after backward training, not after forward running or no training, from 12 to 24 hours. Data are presented as means ± SEM. *P < 0.05. **P < 0.01. ****P < 0.0001, nonparametric test.
Fig. 2
Fig. 2. Postlearning sleep promotes branch-specific spine formation
(A) Schematic of experimental paradigm. After imaging and training (40 trials per session), the animals were either subjected to sleep deprivation or left undisturbed to assess the effect of sleep deprivation. (B) Examples of the EEG and EMG traces. (C) Sleep structure in undisturbed control and SD animals. (D) Percentage of spine formation on the sibling branches over the course of 8 hours under various conditions. Sleep deprivation significantly reduced the rate of spine formation on HFBs, but not LFBs, after training. Corticosterone injection (2.5 mg/kg; n = 4 mice) into non-SD mice had no significant effect on spine formation on HFBs or LFBs during 8 hours. Spine formation on HFBs was significantly higher in SD mice with intensive training (5 mice) than with regular training (9 mice) or no training (4 mice), but significantly lower than that in non-SD mice with regular training (9 mice). (E) Over the course of 16 hours after sleep deprivation, new spine formation on HFBs or LFBs was significantly lower in SD mice than in non-SD mice. Data are presented as means ± SEM. *P < 0.05. **P < 0.01. ***P < 0.001. ****P < 0.0001, nonparametric test.
Fig. 3
Fig. 3. New spines formed during postlearning sleep persist
(A) Schematic of experimental paradigm. (B) More new spines formed on HFBs during hours 0 to 8 persist at 24 hours in non-SD mice (n = 7) than in SD mice (n = 8). (C) Performance improvement is significantly larger in non-SD mice than in SD mice 1 or 5 days after training. (D) New spines formed within 12 hours after forward running were followed over the next 12 hours when the animals were either not trained (n = 5), trained again with the same task (n = 6), or trained with a new task (backward running) (n = 8). (E) Continued training with the same forward-running task facilitates the maintenance of new spines that are formed previously on HFBs. Training with a different task (backward running) significantly reduced the survival of new spines that are formed on LFBs. Data are presented as means ± SEM. *P < 0.05. **P < 0.01, nonparametric test.
Fig. 4
Fig. 4. Branch-specific spine formation involves neuronal reactivation during NREM sleep
(A) Mice were deprived of REM sleep (REMD) over the course of 7 hours after rotarod training. (B) Learning-induced branch-specific spine formation was not affected by REMD (n = 5 mice). (C) Two-photon calcium imaging of layer V neurons from mice expressing GCaMP6 during quiet awake state, prerunning NREM sleep, running, and postrunning NREM sleep. Red arrow points to a soma activated during forward running, and blue arrow points to the same soma reactivated during NREM sleep. (D) Calcium fluorescence traces of three neurons under various states. Examples of 5-min traces are shown. (E) Frequency distribution of cells with somatic Ca2+ change during forward running (617 cells, 17 mice). About 41% of cells show a large increase (>50%) of Ca2+ level in somata during forward running (>1.5 relative to the quiet awake state). (F) Cells (either inactive or active during prerunning sleep) show a large increase (>50%) in somatic Ca2+ level both during running and during postrunning NREM sleep. MK801 administration after running reduced somatic Ca2+ level during NREM sleep. (G) Experimental design to reduce reactivation of forward-running neurons during sleep. Three groups of mice were trained to run forward and allowed to sleep for 4 hours. Subsequently, each group was either subjected to no training (F-N) or trained to run backward (F-B) or forward (F-F), then allowed to sleep for another 4 hours. Reactivation of forward running-specific cells (ΔFforw. runningFquiet > 1.5 and ΔFbackw. runningFquiet < 1.5) was significantly reduced during the second 4-hour sleep after mice were trained with a backward-running task (F-B). (H) Experimental design is the same as in (G). The rate of spine formation on HFBs was significantly reduced either after MK801 administration or in the F-B group as compared to the F-F or F-N group. Data are presented as means ± SEM. *P < 0.05. **P < 0.01. ***P < 0.001. ****P < 0.0001, non-parametric test.

Comment in

References

    1. Maquet P. Science. 2001;294:1048–1052. - PubMed
    1. Siegel JM. Nature. 2005;437:1264–1271. - PMC - PubMed
    1. Stickgold R. Nature. 2005;437:1272–1278. - PubMed
    1. Diekelmann S, Born J. Nat Rev Neurosci. 2010;11:114–126. - PubMed
    1. Benington JH, Frank MG. Prog Neurobiol. 2003;69:71–101. - PubMed

Publication types