. 2014 May 27:8:136.
doi: 10.3389/fncel.2014.00136. eCollection 2014.

Selective modulation of cellular voltage-dependent calcium channels by hyperbaric pressure-a suggested HPNS partial mechanism

Affiliations

Selective modulation of cellular voltage-dependent calcium channels by hyperbaric pressure-a suggested HPNS partial mechanism

Ben Aviner et al. Front Cell Neurosci. .

Abstract

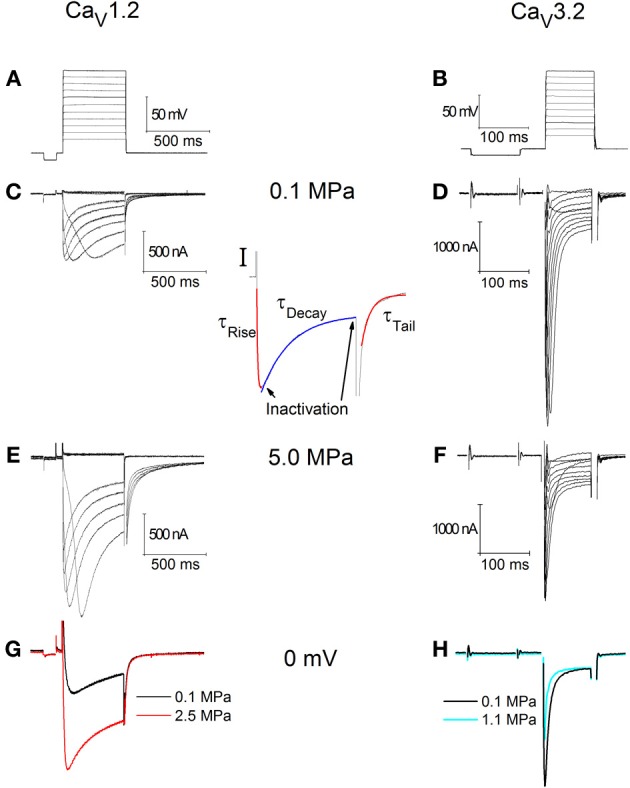
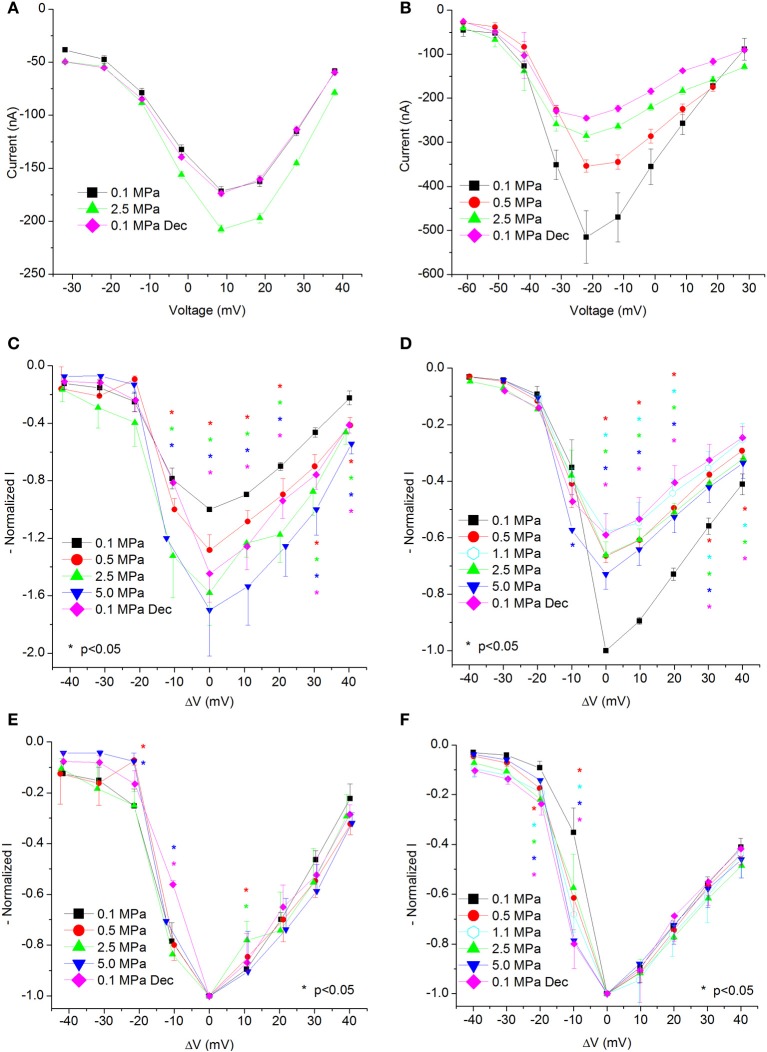
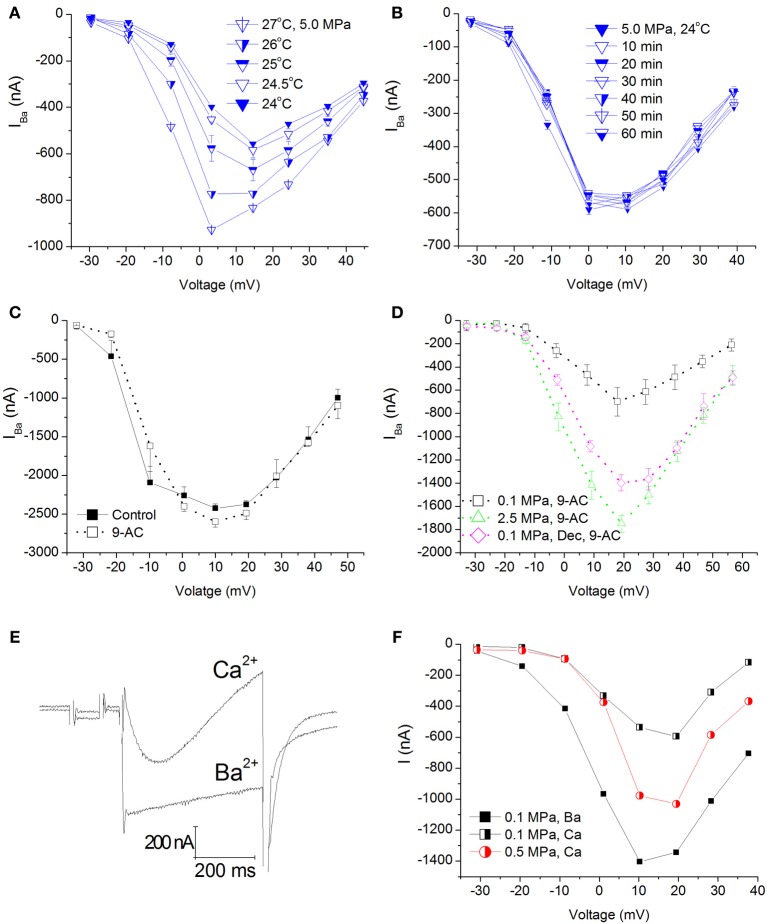
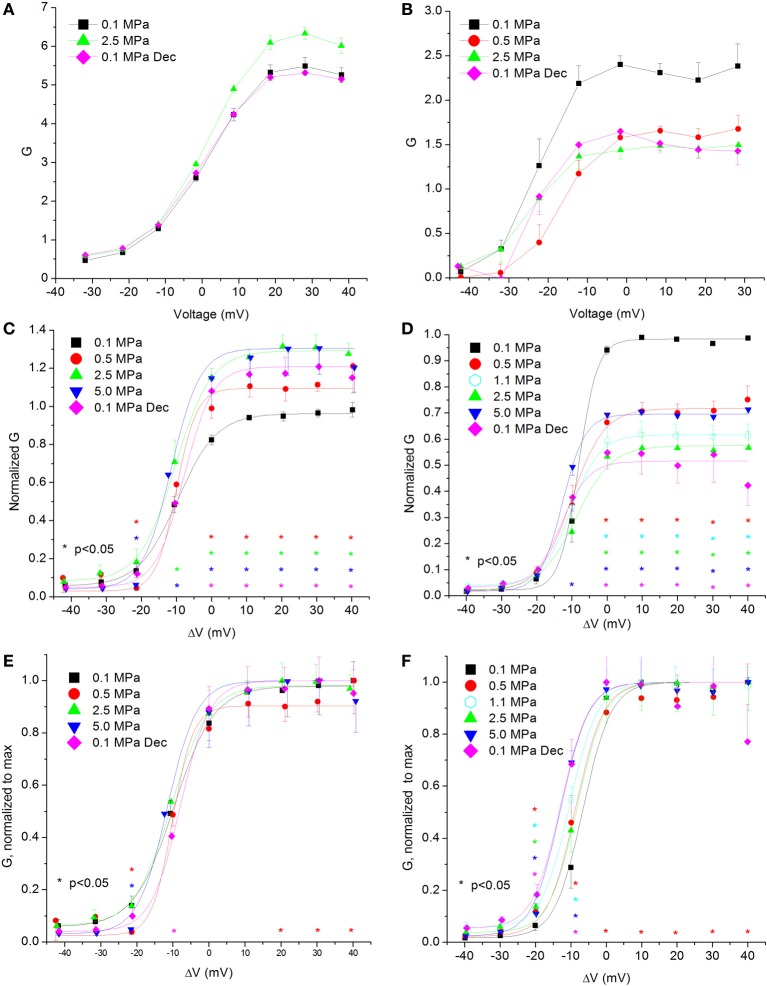
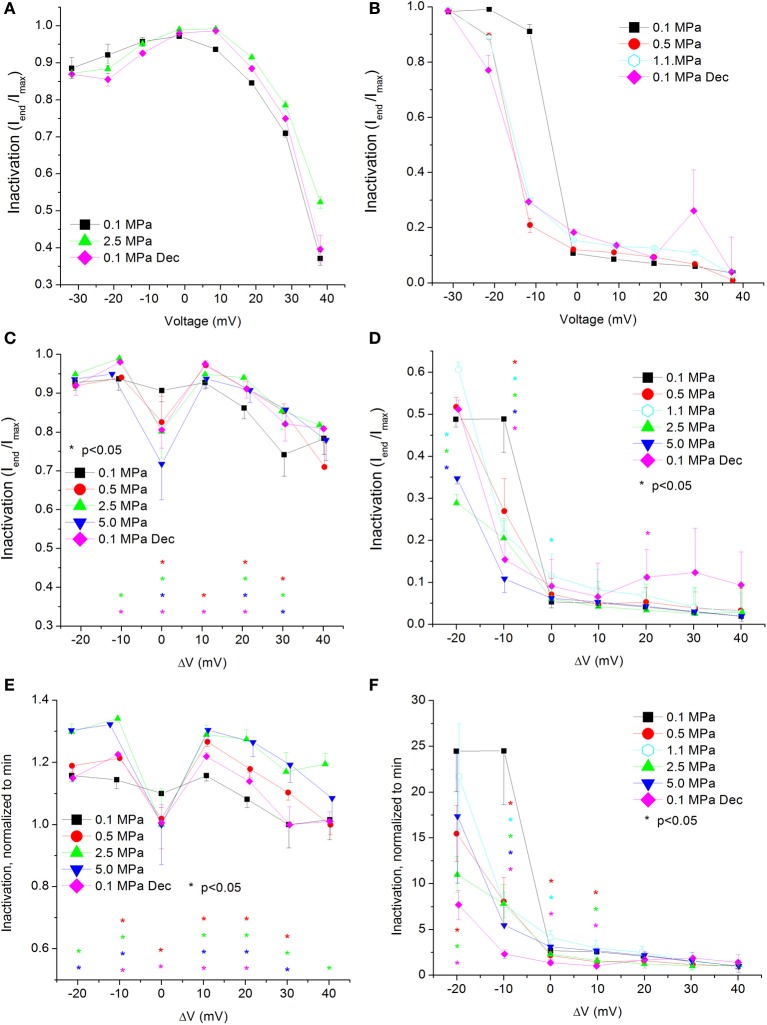
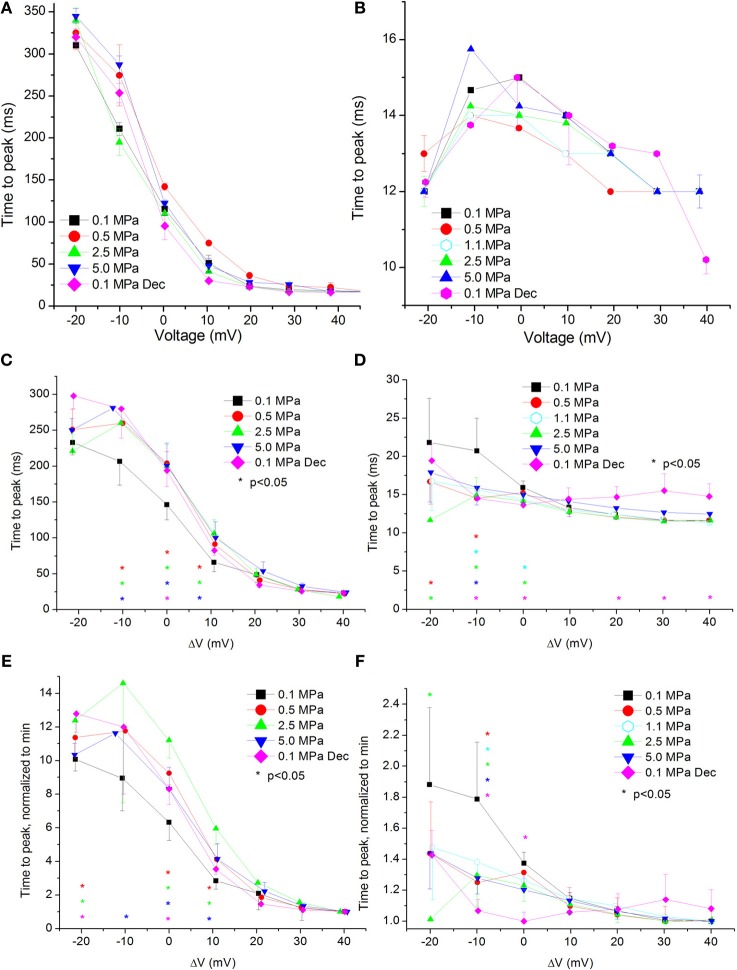
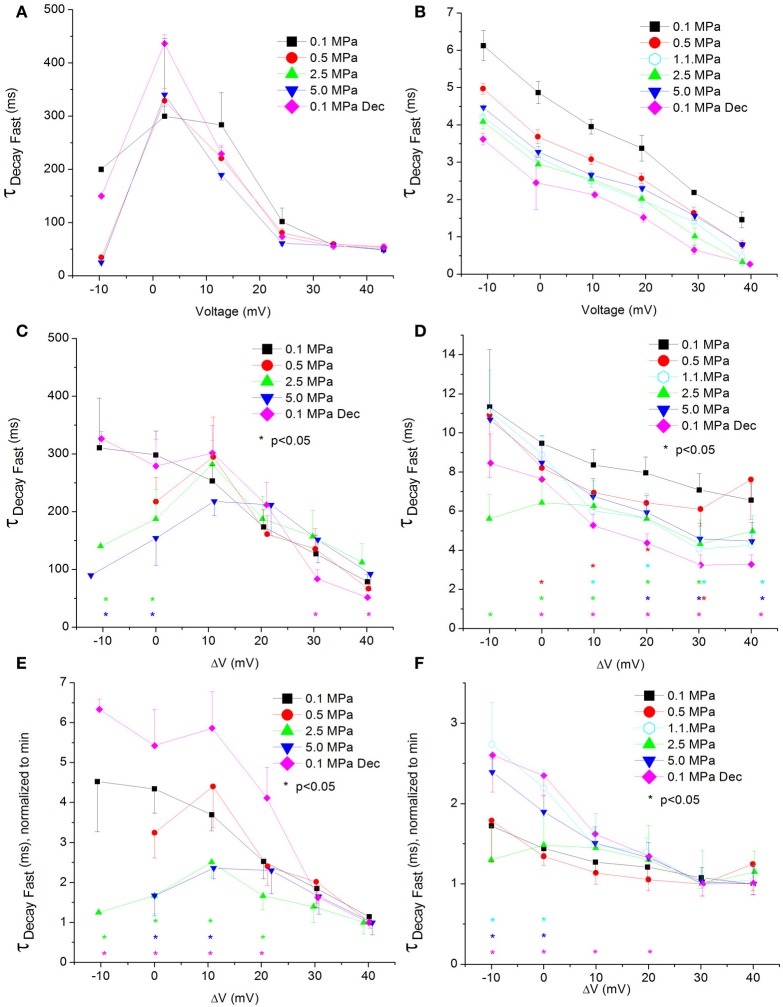
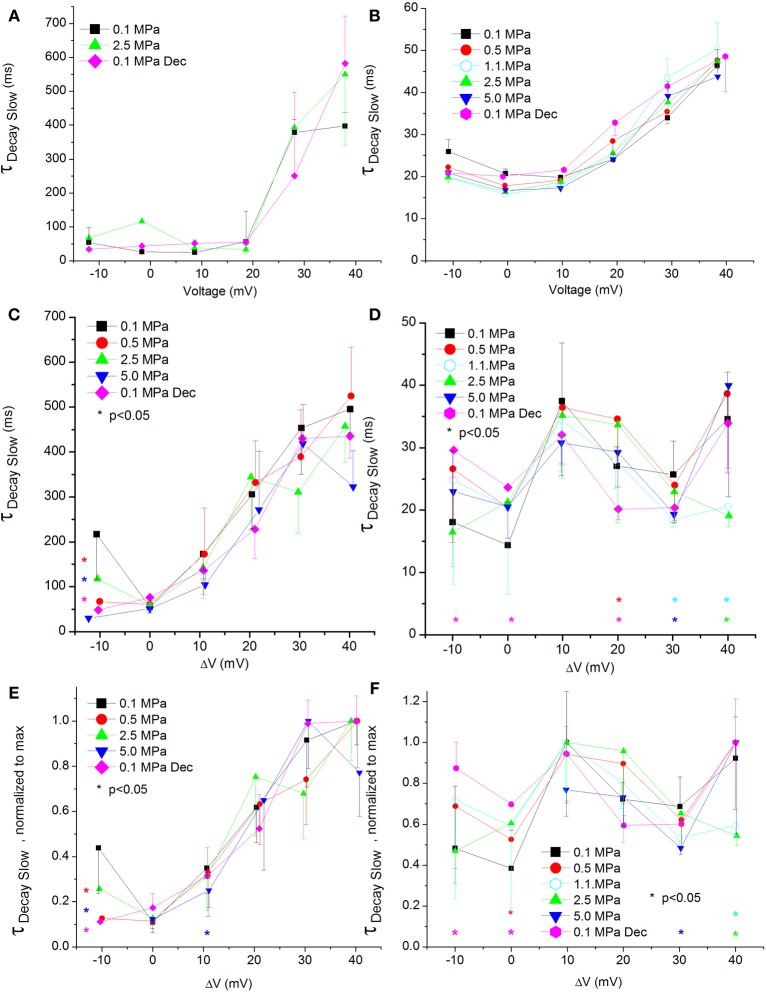
Professional deep sea divers experience motor and cognitive impairment, known as High Pressure Neurological Syndrome (HPNS), when exposed to pressures of 100 msw (1.1 MPa) and above, considered to be the result of synaptic transmission alteration. Previous studies have indicated modulation of presynaptic Ca(2+) currents at high pressure. We directly measured for the first time pressure effects on the currents of voltage dependent Ca(2+) channels (VDCCs) expressed in Xenopus oocytes. Pressure selectivity augmented the current in CaV1.2 and depressed it in CaV3.2 channels. Pressure application also affected the channels' kinetics, such as ƮRise, ƮDecay. Pressure modulation of VDCCs seems to play an important role in generation of HPNS signs and symptoms.

Keywords: conformational change; high pressure; high pressure neurological syndrome; hyperbaric helium pressure; synaptic transmission; voltage dependency; voltage dependent calcium channels.


Figures

Figure 1
Figure 1
Currents recorded in CaV1.2 (C,E,G) and CaV3.2 (D,F,H) channels. (A) Depolarization steps for (C,E). (B) Depolarization step for (D,F). (C,D) Ba2+ currents at 0.1 MPa. (E,F) Ba2+ currents at 5.0 MPa. Note current increase in (E) at HP and decrease in (F). (G,H) Superimposed single current traces under normo- and hyperbaric conditions, in response to identical depolarization to 0 mV. (I) Indication of the corresponding sections of the currents used to calculate the inactivation and kinetics parameters.
Figure 2
Figure 2
I-V curves of maximal currents. (A,C,E) CaV1.2, (B,D,F) CaV3.2 channels. (A,B) I-V curve of a single oocyte. (C,D) Pooled data from 9 to 17 (C) and 7 to 9 (D) oocytes exposed to 0.5–5.0 MPa pressure (color indicated). Holding potential is adjusted so that 0 indicates the potential at which maximal current is obtained (VImax). (E,F) Normalized-to-max I-V curves. Each curve is normalized to its own maximal value and corresponds to its pertinent curve in (C,D). Holding potential is adjusted as in (C,D). Statistical significance for each point on the curve is indicated by corresponding color asterisks (p < 0.05). Dec indicates decompression.
Figure 3
Figure 3
Temperature, time, ClCa channel blocker, and Ca2+ ion control experiments in CaV1.2 channel. (A) I–V curves measured at 5.0 MPa repeatedly while the preparation's adiabatic temperature change is subsiding. (B) I-V curves measured in a different oocyte for 1 h at 5.0 MPa after control temperature was regained. (C) I-V curves measured in a solution containing 9-AC. (D) I-V curves of compression and decompression performed with 9-AC. The expected HP effect (augmentation) is evident. (E) Example of current traces recorded with Ca2+ or Ba2+ ions in the solution at the same depolarization to 0 mV. Note the stronger and faster inactivation with Ca2+. (F) Compression to 0.5 MPa when Ba2+ ions were replaced by Ca2+ ions. Replacement of ions caused a decrease of the currents at 0.1 MPa, but compression to 0.5 MPa still augmented the Ca2+ current in a similar manner to Ba2+ experiments.
Figure 4
Figure 4
Channels' conductance at various pressures. (A,C,E) In CaV1.2 and (B,D,F) in CaV3.2 channels. (A,B) Conductance measured in a single oocyte. (C,D) Pooled data of the channels. (E,F) Normalized conductance: each curve is normalized to its own maximal value and corresponds to its pertinent curve in (C,D). A Boltzmann fit was used in (C–F). Pressures are color indicated. Statistical significance for each point on the curve is indicated by corresponding color asterisks. Holding potential is expressed as in Figure 2. Dec indicates decompression.
Figure 5
Figure 5
Voltage- and time-dependent current inactivation (Iend/Imax) at various pressures. (A,C,E) In CaV1.2 and (B,D,F) in CaV3.2 channels. (A,B) Inactivation measured in a single oocyte. (C,D) Pooled data of the channels. (E,F) Normalized inactivation: each curve is normalized to its own minimal value and corresponds to its pertinent curve in (C,D). Pressures are color indicated. Statistical significance for each point on the curve is indicated by corresponding color asterisks. Holding potential is expressed as in Figure 2. Dec indicates decompression.
Figure 6
Figure 6
Time to current peak (TTP, from stimulus onset) at various pressures. (A,C,E) in CaV1.2 and (B,D,F) in CaV3.2 channels. (A,B) TTP measured in a single oocyte. (C,D). Pooled data of the channels. (E,F) Normalized TTP: each curve is normalized to its own minimal value and corresponds to its pertinent curve in (C,D) Pressures are color indicated. Statistical significance for each point on the curve is indicated by corresponding color asterisks. Holding potential is expressed as in Figure 2. Dec indicates decompression.
Figure 7
Figure 7
Time constant of current activation (ƮRise) in CaV1.2 channel. (A) ƮRise measured in a single oocyte. (B) Pooled data of ƮRise from 7 to 16 oocytes. (C) Normalized ƮRise: each curve is normalized to its own minimal value and corresponds to its pertinent curve in (B). Pressures are color indicated. Statistical significance for each point on the curve is indicated by corresponding color asterisks. Holding potential is expressed as in Figure 2. Dec indicates decompression.
Figure 8
Figure 8
Fast time constant of voltage- and time-dependent current inactivation (ƮDecay Fast). (A,C,E) in CaV1.2 and (B,D,F) in CaV3.2 channels. (A,B) ƮDecay Fast measured in a single oocyte. (C,D) Pooled data of the channels. (E,F) Normalized ƮDecay Fast: each curve is normalized to its own minimal value and corresponds to its pertinent curve in (C,D). Pressures are color indicated. Statistical significance for each point on the curve is indicated by corresponding color asterisks. Holding potential is expressed as in Figure 2. Dec indicates decompression.
Figure 9
Figure 9
Slow time constant of voltage- and time-dependent current inactivation (ƮDecay Slow). (A,C,E) in CaV1.2 and (B,D,F) in CaV3.2 channels. (A,B) ƮDecay Slow measured in a single oocyte. (C,D) Pooled data of the channels ƮDecay Slow. (E,F) Normalized ƮDecay Slow: each curve is normalized to its own maximal value and corresponds to its pertinent curve in (C,D). Pressures are color indicated. Statistical significance for each point on the curve is indicated by corresponding color asterisks. Holding potential is expressed as in Figure 2. Dec indicates decompression.
Figure 10
Figure 10
Tail current time constant (ƮTail) in CaV1.2 channel. (A) ƮTail measured in a single oocyte. (B) Pooled data of ƮTail from 7 to 16 oocytes. Only 5.0 MPa has affected (reduced) ƮTail throughout the channels' activity range. (C) Normalized ƮTail: each curve is normalized to its own minimal value and corresponds to its pertinent curve in (B). Pressures are color indicated. Statistical significance for each point on the curve is indicated by corresponding color asterisks. Holding potential is expressed as in Figure 2. Dec indicates decompression.

References

    1. Abraini J. H. (1997). Inert gas and raised pressure: evidence that motor decrements are due to pressure per se and cognitive decrements due to narcotic action. Pflugers Arch. 433, 788–791 10.1007/s004240050346 - DOI - PubMed
    1. Allen B. W., Demchenko I. T., Piantadosi C. A. (2009). Two faces of nitric oxide: implications for cellular mechanisms of oxygen toxicity. J. Appl. Physiol. 106, 662–667 10.1152/japplphysiol.91109.2008 - DOI - PubMed
    1. Ashford M. L., MacDonald A. G., Wann K. T. (1982). The effects of hydrostatic pressure on the spontaneous release of transmitter at the frog neuromuscular junction. J. Physiol. 333, 531–543 - PMC - PubMed
    1. Aviner B., Gnatek Y., Gradwohl G., Grossman Y. (2010). Hyperbaric pressure effects on voltage-dependent Ca+2 channels: relevance to HPNS. Undersea Hyperb. Med. 37, 245–258 - PubMed
    1. Aviner B., Gradwohl G., Moore H. J., Grossman Y. (2013). Modulation of presynaptic Ca2+ currents in frog motor nerve terminals by high pressure. Eur. J. Neurosci. 38, 2716–2729 10.1111/ejn.12267 - DOI - PubMed

LinkOut - more resources