. 2014 May 20:8:92.
doi: 10.3389/fnsys.2014.00092. eCollection 2014.

Distinct regions of the cerebellum show gray matter decreases in autism, ADHD, and developmental dyslexia

Affiliations

Distinct regions of the cerebellum show gray matter decreases in autism, ADHD, and developmental dyslexia

Catherine J Stoodley. Front Syst Neurosci. .

Abstract

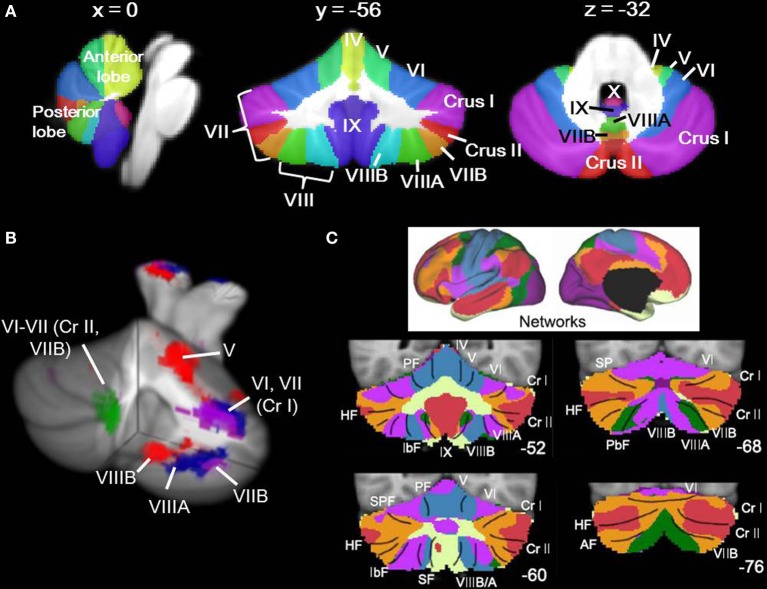
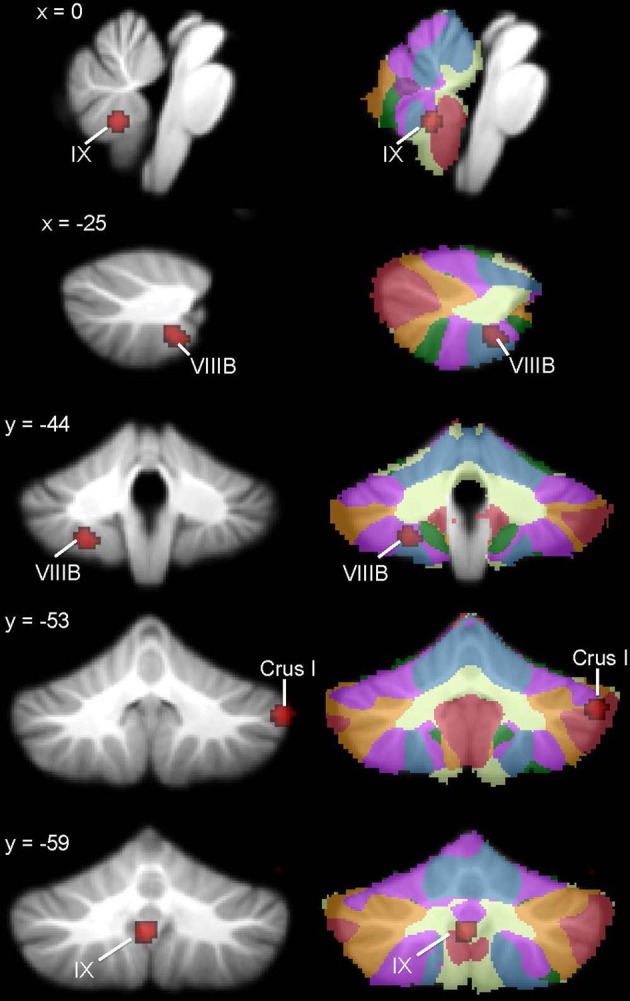
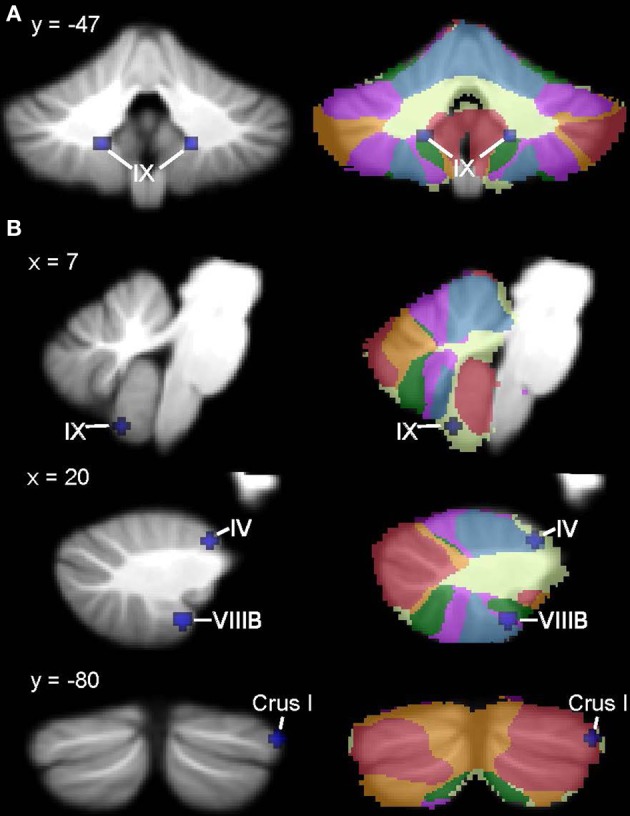
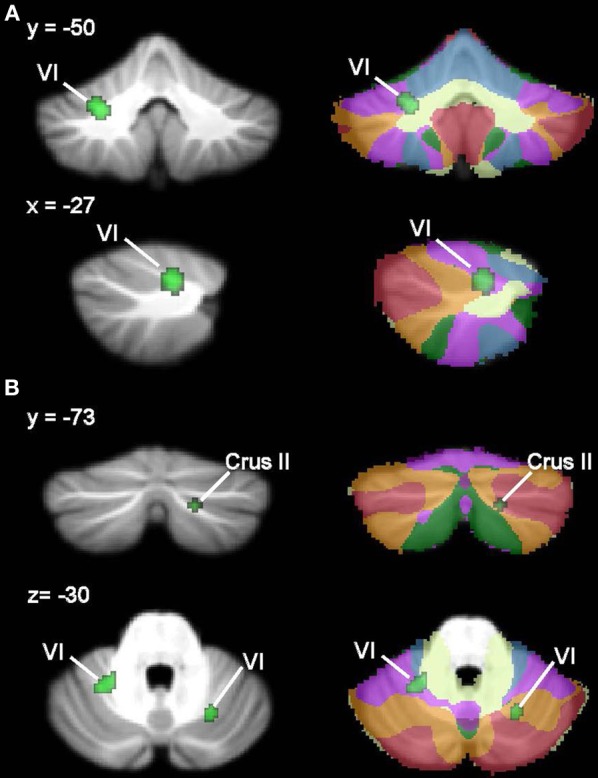
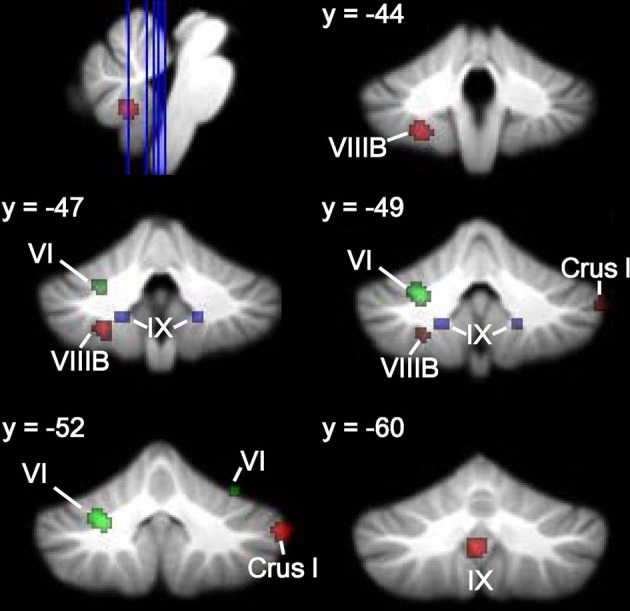
Differences in cerebellar structure have been identified in autism spectrum disorder (ASD), attention deficit hyperactivity disorder (ADHD), and developmental dyslexia. However, it is not clear if different cerebellar regions are involved in each disorder, and thus whether cerebellar anatomical differences reflect a generic developmental vulnerability or disorder-specific characteristics. To clarify this, we conducted an anatomic likelihood estimate (ALE) meta-analysis on voxel-based morphometry (VBM) studies which compared ASD (17 studies), ADHD (10 studies), and dyslexic (10 studies) participants with age-matched typically-developing (TD) controls. A second ALE analysis included studies in which the cerebellum was a region of interest (ROI). There were no regions of significantly increased gray matter (GM) in the cerebellum in ASD, ADHD, or dyslexia. Data from ASD studies revealed reduced GM in the inferior cerebellar vermis (lobule IX), left lobule VIIIB, and right Crus I. In ADHD, significantly decreased GM was found bilaterally in lobule IX, whereas participants with developmental dyslexia showed GM decreases in left lobule VI. There was no overlap between the cerebellar clusters identified in each disorder. We evaluated the functional significance of the regions revealed in both whole-brain and cerebellar ROI ALE analyses using Buckner and colleagues' 7-network functional connectivity map available in the SUIT cerebellar atlas. The cerebellar regions identified in ASD showed functional connectivity with frontoparietal, default mode, somatomotor, and limbic networks; in ADHD, the clusters were part of dorsal and ventral attention networks; and in dyslexia, the clusters involved ventral attention, frontoparietal, and default mode networks. The results suggest that different cerebellar regions are affected in ASD, ADHD, and dyslexia, and these cerebellar regions participate in functional networks that are consistent with the characteristic symptoms of each disorder.

Keywords: attention deficit hyperactivity disorder; autism spectrum disorder; cerebellum; developmental dyslexia; meta-analysis.


Figures

Figure 1
Figure 1
Cerebellar anatomy and functional topography. (A) Cerebellar anatomy shown on coronal, sagittal, and axial slices through the Spatially Unbiased Infratentorial (SUIT) atlas (Diedrichsen, ; Diedrichsen et al., 2009). The cerebellum is subdivided into three lobes (anterior, posterior, and flocculonodular [lobule X]) and 10 lobules (I-X). In humans, lobule VII is subdivided into Crus I, Crus II, and VIIB, and lobule VIII is divided into VIIIA and VIIIB. Yellow, lobules I–IV; light green, lobule V; blue, lobule VI; purple, lobule VII (Crus I); red, lobule VII (Crus II); orange, lobule VII (VIIB); green, lobule VIIIA; aqua, lobule VIIIB; dark purple, lobule IX; pink-purple, X. (B) Functional topography revealed by task-based neuroimaging (Stoodley et al., 2012b). Activation related to right-handed finger tapping (red), language tasks (blue), working memory (violet), and spatial (green) tasks is shown. (C) Functional connectivity of the cerebellum based on correlations with cortical networks (adapted with permission from Buckner et al., 2011). Dark purple, visual; blue, somatomotor; green, dorsal attention; violet, ventral attention; cream, limbic; orange, frontoparietal; red, default network.
Figure 2
Figure 2
Cerebellar GM differences in ASD. Left, regions in the whole-brain analysis showing significant ALE voxels where ASD < TD (red), thresholded at p < 0.001, k > 50. Right, corresponding slices showing functional connectivity maps of the cerebellum (Buckner et al., 2011). Networks are color-coded such that blue, somatomotor; green, dorsal attention; violet, ventral attention; cream, limbic; orange, frontoparietal; red, default network.
Figure 3
Figure 3
ASD cerebellar ROI analysis. Left, ASD < TD in additional IX and right Crus I clusters (red) and regions where ASD > TD (violet) in the right dentate nucleus and bilaterally in VIIB. These ALE maps are thresholded at FDR-corrected p < 0.05, k > 50. Right, corresponding slices showing functional connectivity maps of the cerebellum (Buckner et al., 2011). Networks are color-coded such that blue, somatomotor; green, dorsal attention; violet, ventral attention; cream, limbic; orange, frontoparietal; red, default network.
Figure 4
Figure 4
ADHD < TD GM: whole-brain and ROI analyses. Left (A), Regions in the whole-brain analysis showing significant ALE voxels where ADHD < TD (blue), thresholded at p < 0.001, k > 50. (B) Regions showing ADHD < TD in the ROI analysis. Right, corresponding slices showing functional connectivity maps of the cerebellum (Buckner et al., 2011). Networks are color-coded such that blue, somatomotor; green, dorsal attention; violet, ventral attention; cream, limbic; orange, frontoparietal; red, default network.
Figure 5
Figure 5
Dyslexia < TD GM: whole-brain and ROI analyses. Left (A), Regions in the whole-brain analysis showing significant ALE voxels where Dyslexia < TD (green), thresholded at p < 0.001, k > 50. (B) Regions showing Dyslexia < TD in the ROI analysis. Right, corresponding slices showing functional connectivity maps of the cerebellum (Buckner et al., 2011). Networks are color-coded such that blue, somatomotor; green, dorsal attention; violet, ventral attention; cream, limbic; orange, frontoparietal; red, default network.
Figure 6
Figure 6
Different cerebellar regions affected in ASD vs. ADHD vs. dyslexia. Coronal slices through the cerebellum show clusters of GM decreases in ASD (red), ADHD (blue), and dyslexia (green).
Figure 7
Figure 7
Different cerebellar regions affected in ASD vs. ADHD vs. dyslexia in the cerebellar ROI analyses. Coronal, axial, and sagittal slices through the cerebellum show clusters of GM decreases in ASD (red), ADHD (blue), and dyslexia (green) resulting from the ROI analysis.

Similar articles

Cited by

References

    1. Abell F., Krams M., Ashburner J., Passingham R., Friston K., Frackowiak R., et al. (1999). The neuroanatomy of autism: a voxel-based whole brain analysis of structural scans. Neuroreport 10, 1647–1651 10.1097/00001756-199906030-00005 - DOI - PubMed
    1. Abrahams B. S., Geschwind D. H. (2010). Connecting genes to brain in the autism spectrum disorders. Arch. Neurol. 67, 395–399 10.1001/archneurol.2010.47 - DOI - PMC - PubMed
    1. Ahrendts J., Rusch N., Wilke M., Philipsen A., Eickhoff S. B., Glauche V., et al. (2010). Visual cortex abnormalities in adults with ADHD: a structural MRI study. World J. Biol. Psychiatry 12, 260–270 10.3109/15622975.2010.518624 - DOI - PubMed
    1. Allen G., McColl R., Barnard H., Ringe W., Fleckenstein J., Cullum C. (2005). Magnetic resonance imaging of cerebellar-prefrontal and cerebellar parietal functional connectivity. Neuroimage 28, 39–48 10.1016/j.neuroimage.2005.06.013 - DOI - PubMed
    1. American Psychiatric Association (2000). Diagnostic and Statistical Manual of Mental Disorders, 4th Edn., Text revision. Washington, DC: American Psychiatric Association; 10.1176/appi.books.9780890423349 - DOI

LinkOut - more resources