

Encoding cortical dynamics in sparse features
- PMID: 24904377
- PMCID: PMC4033054
- DOI: 10.3389/fnhum.2014.00338
Encoding cortical dynamics in sparse features
Abstract
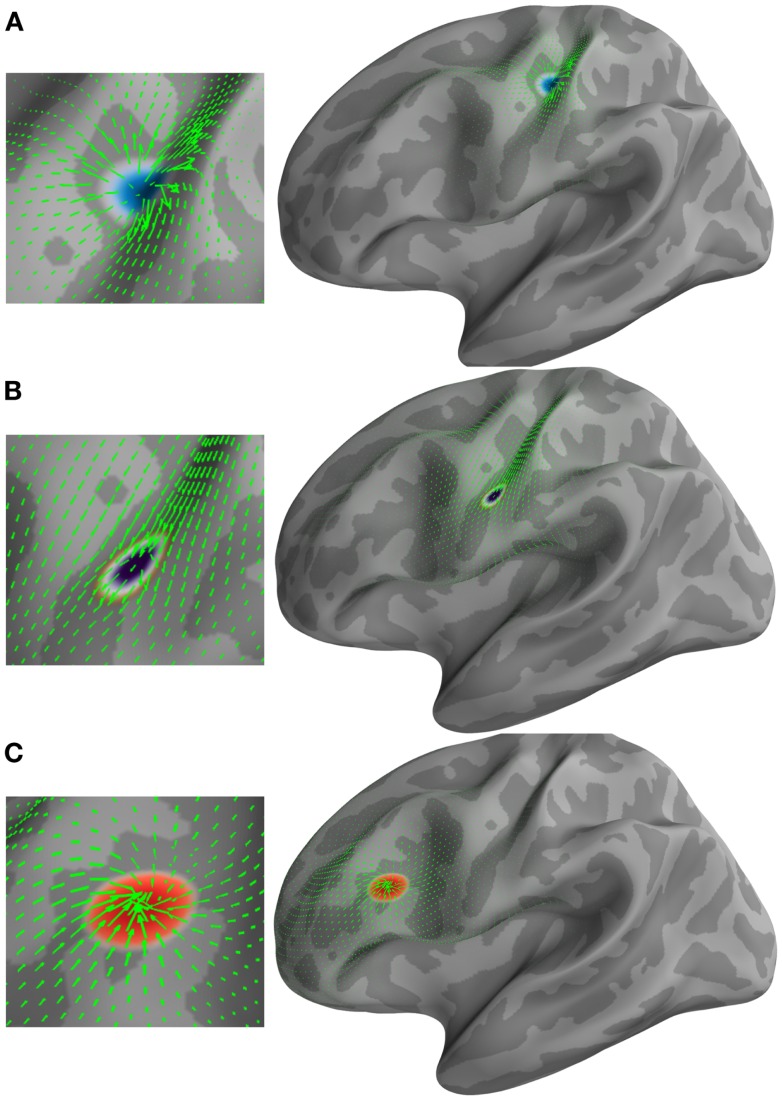
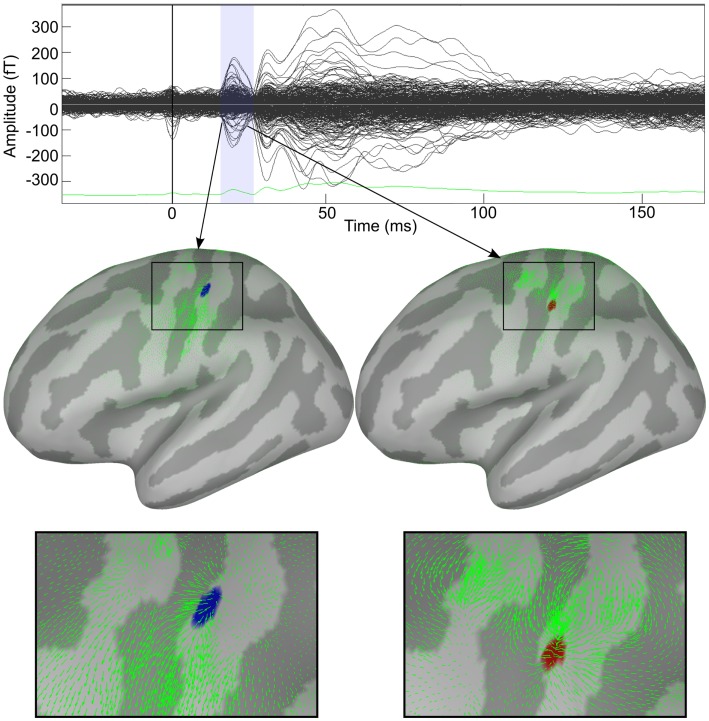
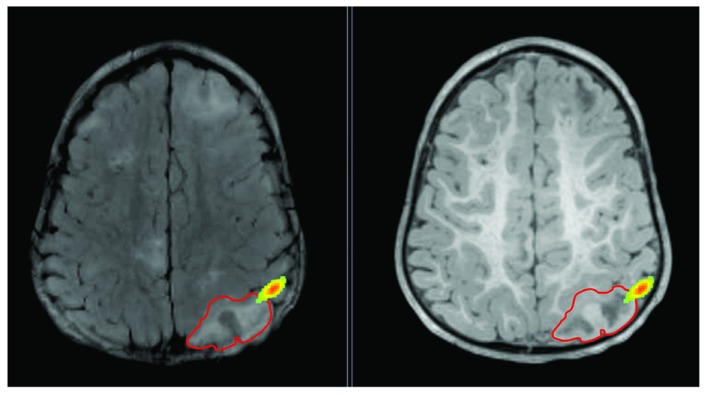
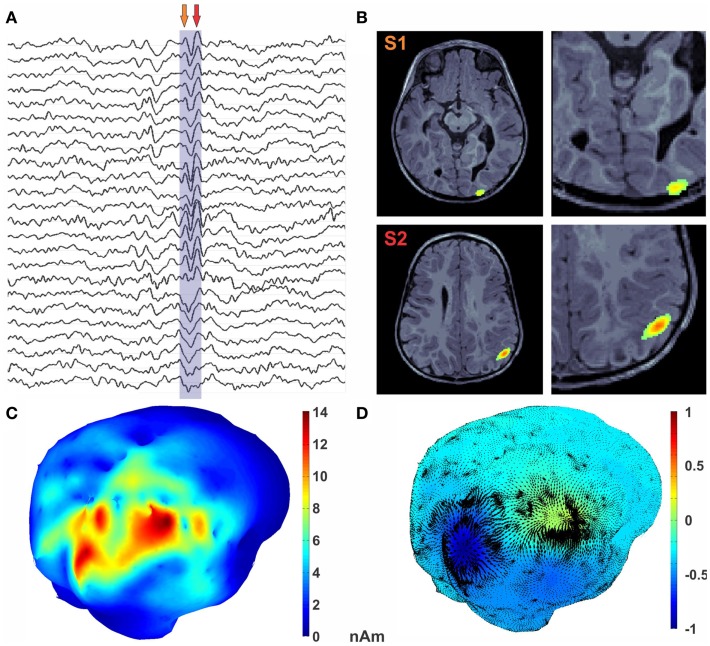
Distributed cortical solutions of magnetoencephalography (MEG) and electroencephalography (EEG) exhibit complex spatial and temporal dynamics. The extraction of patterns of interest and dynamic features from these cortical signals has so far relied on the expertise of investigators. There is a definite need in both clinical and neuroscience research for a method that will extract critical features from high-dimensional neuroimaging data in an automatic fashion. We have previously demonstrated the use of optical flow techniques for evaluating the kinematic properties of motion field projected on non-flat manifolds like in a cortical surface. We have further extended this framework to automatically detect features in the optical flow vector field by using the modified and extended 2-Riemannian Helmholtz-Hodge decomposition (HHD). Here, we applied these mathematical models on simulation and MEG data recorded from a healthy individual during a somatosensory experiment and an epilepsy pediatric patient during sleep. We tested whether our technique can automatically extract salient dynamical features of cortical activity. Simulation results indicated that we can precisely reproduce the simulated cortical dynamics with HHD; encode them in sparse features and represent the propagation of brain activity between distinct cortical areas. Using HHD, we decoded the somatosensory N20 component into two HHD features and represented the dynamics of brain activity as a traveling source between two primary somatosensory regions. In the epilepsy patient, we displayed the propagation of the epileptic activity around the margins of a brain lesion. Our findings indicate that HHD measures computed from cortical dynamics can: (i) quantitatively access the cortical dynamics in both healthy and disease brain in terms of sparse features and dynamic brain activity propagation between distinct cortical areas, and (ii) facilitate a reproducible, automated analysis of experimental and clinical MEG/EEG source imaging data.
Keywords: Helmholtz–Hodge decomposition; MEG source imaging; epilepsy; motion field; optical flow.
Figures
References
-
- Baillet S., Mosher J., Leahy R. (2001). Electromagnetic brain mapping. IEEE Signal Process. Mag. 18, 14–3010.1109/79.962275 - DOI
-
- Do Carmo M. (1993). Riemannian Geometry. Boston: Birkhäuser
Grants and funding
LinkOut - more resources
Full Text Sources
Other Literature Sources