. 2014 May 20:5:219.
doi: 10.3389/fmicb.2014.00219. eCollection 2014.

Deciphering microbial interactions and detecting keystone species with co-occurrence networks

Affiliations

Deciphering microbial interactions and detecting keystone species with co-occurrence networks

David Berry et al. Front Microbiol. .

Abstract

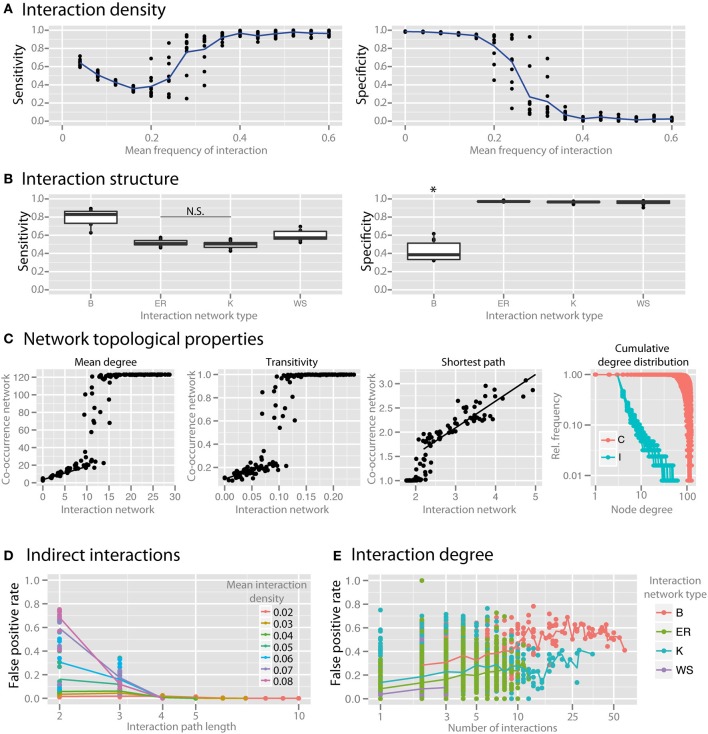
Co-occurrence networks produced from microbial survey sequencing data are frequently used to identify interactions between community members. While this approach has potential to reveal ecological processes, it has been insufficiently validated due to the technical limitations inherent in studying complex microbial ecosystems. Here, we simulate multi-species microbial communities with known interaction patterns using generalized Lotka-Volterra dynamics. We then construct co-occurrence networks and evaluate how well networks reveal the underlying interactions and how experimental and ecological parameters can affect network inference and interpretation. We find that co-occurrence networks can recapitulate interaction networks under certain conditions, but that they lose interpretability when the effects of habitat filtering become significant. We demonstrate that networks suffer from local hot spots of spurious correlation in the neighborhood of hub species that engage in many interactions. We also identify topological features associated with keystone species in co-occurrence networks. This study provides a substantiated framework to guide environmental microbiologists in the construction and interpretation of co-occurrence networks from microbial survey datasets.

Keywords: 16S rRNA sequencing surveys; Lotka-Volterra models; correlation analysis; habitat filtering; keystone species; microbial competition; microbial cooperation; network analysis.


Figures

Figure 1
Figure 1
Simulating microbial communities with generalized Lotka-Volterra modeling for co-occurrence network testing. The main steps in the simulations are (1) producing an interaction matrix and directed network for a metacommunity, (2) simulating population dynamics in individual communities until steady state abundances are reached, (3) constructing a co-occurrence network, and (4) evaluating the extent to which the co-occurrence network reflects the interaction network, as well as the ecological significance of topological features of the network. Positive interactions and correlations are indicated in black and negative interactions and correlations in red. In the interaction network an arrow indicates the direction of interaction.
Figure 2
Figure 2
Effect of experimental and analytical parameters on co-occurrence network performance. The sensitivity and specificity of co-occurrence networks in revealing direct interactions was tested using the standard community of 100 species per site, 100 sites with 80% species overlap between them, carrying capacities drawn from a uniform distribution and an average of 2 interactions per species, while varying the following parameters: (A) sampling breadth (i.e., number of samples), (B) association metric used (MI = mutual information score), (C) and use of absolute abundance (AA), relative abundance (RA), or sparCC-corrected relative abundance (RA-corrected) data. For (C) the different data types were compared for communities with uniformly- or log-normally-distributed species abundances. All comparisons in the left panel of (B,C) are significant (p < 0.05) except where denotes with N.S. *indicates p < 0.05 for all comparisons against all other conditions that are not starred.
Figure 3
Figure 3
Effect of ecological properties on co-occurrence network performance. The sensitivity and specificity of co-occurrence networks in revealing direct interactions was tested using the standard community, while varying aspects of α and β diversity. Properties evaluated were the diversity properties: (A) per-site species richness, and (B) species evenness. Evenness was controlled by drawing species carrying capacities from either (i) a scaled β distribution (α parameter = 1) and tuning β from 1 (equivalent to a uniform distribution) to 20 to increase unevenness, or (ii) a scaled lognormal distribution. (C) β diversity was evaluated by modifying the site similarity (or Jaccard similarity), which is the mean percentage of shared species between any two local communities in the meta-community.
Figure 4
Figure 4
Effect of heterogeneity and habitat filtering on co-occurrence network performance. The sensitivity and specificity of co-occurrence networks in revealing direct interactions was tested using the standard community, while varying carrying capacity and species overlap. (A) Heterogeneity was simulated by stochastically varying species carrying capacities at each local site with a certain variance. This is analogous to the additional noise that would be expected if sites were near to, but not yet in, steady state. (B) The effect of habitat filtering was explored as a function of filtering intensity, which is the percent of the metacommunity that cannot occupy multiple habitats (i.e., percent habitat specialists).
Figure 5
Figure 5
Effect of interaction structure on co-occurrence network performance. The sensitivity and specificity of co-occurrence networks in revealing direct interactions was tested using the standard community under different interaction scenarios. (A) Interaction density of random (ER) networks, or the mean frequency of an interaction between any two species, was varied between 0 and 0.6. (B) Interaction networks with different structures but with the same mean interaction density (0.02) were simulated. Interaction networks were chosen to have random (ER), small-world (WS), scale-free (B), and small-world, scale free and modular (K) properties. (C) The ability of the co-occurrence network to reproduce the interaction network topology was examined for a few key network parameters: the mean degree, transitivity, the mean shortest path length, and cumulative degree distribution. Black lines indicate regions for which a linear model was fit. Standard community with mean species number set to 50 per site was used for (C–E). (D) For ER networks of varying interaction densities, the false positive rate (FPR) was determined with respect to the interaction path length between the species incorrectly identified as directly interacting. (E) For different interaction network structures, the per-species FPR was identified with respect to the number of interactions (i.e., the interaction degree) of the species. All comparisons in the left panel of (B) are significant (p < 0.05) except where denotes with N.S. *indicates p < 0.05 for all comparisons against all other conditions that are not starred.
Figure 6
Figure 6
Identifying keystone species in co-occurrence networks. For keystone species analysis standard communities with mean species number of 50 species per site were used. (A) For each species, the number of species lost when it is removed from the community is plotted. The larger number of species lost, the higher the keystoneness. Lost species are separated into those that interacted either directly or indirectly with the keystone, and the sign (for direct interactions) or the net sign (for indirect interactions) of the interaction is shown. (B) Selected topological properties are shown in example networks, with the color (from light to dark) and size (from small to large) of each node scaled to the value of the property. Arrows indicate possible keystone species based on the results shown in (C). (C) Topological properties of keystones in both the interaction network (top row) and the co-occurrence network (bottom row) colored by interaction network type are shown.

References

    1. Acinas S. G., Marcelino L. A., Klepac-Ceraj V., Polz M. F. (2004). Divergence and redundancy of 16S rRNA sequences in genomes with multiple rrn operons. J. Bacteriol. 186, 2629–2635 10.1128/JB.186.9.2629-2635.2004 - DOI - PMC - PubMed
    1. Aitchison J. (2003). A concise guide to compositional data analysis, in 2nd Compositional Data Analysis Workshop (Girona: ).
    1. Baker B. J., Banfield J. F. (2003). Microbial communities in acid mine drainage. FEMS Microbiol. Rev. 44, 139–152 10.1016/S0168-6496(03)00028-X - DOI - PubMed
    1. Barabasi A., Albert R. (1999). Emergence of scaling in random networks. Science 286, 509–512 10.1126/science.286.5439.509 - DOI - PubMed
    1. Barberán A., Bates S. T., Casamayor E. O., Fierer N. (2012). Using network analysis to explore co-occurrence patterns in soil microbial communities. ISME J. 6, 343–351 10.1038/ismej.2011.119 - DOI - PMC - PubMed