

Elucidation of Zymomonas mobilis physiology and stress responses by quantitative proteomics and transcriptomics
- PMID: 24904559
- PMCID: PMC4033097
- DOI: 10.3389/fmicb.2014.00246
Elucidation of Zymomonas mobilis physiology and stress responses by quantitative proteomics and transcriptomics
Abstract
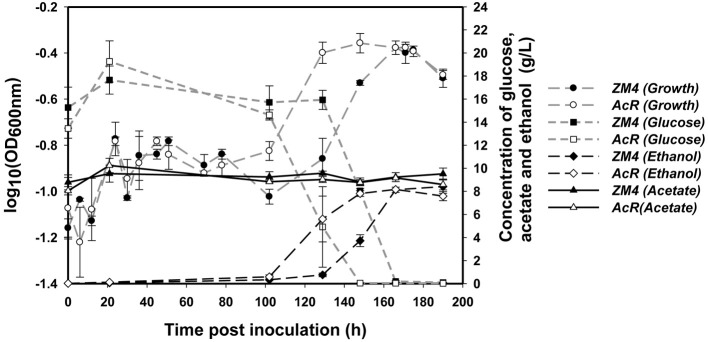
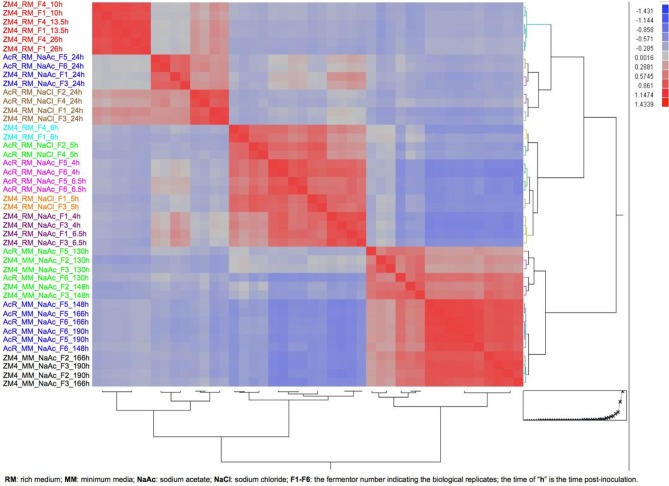
Zymomonas mobilis is an excellent ethanologenic bacterium. Biomass pretreatment and saccharification provides access to simple sugars, but also produces inhibitors such as acetate and furfural. Our previous work has identified and confirmed the genetic change of a 1.5-kb deletion in the sodium acetate tolerant Z. mobilis mutant (AcR) leading to constitutively elevated expression of a sodium proton antiporter encoding gene nhaA, which contributes to the sodium acetate tolerance of AcR mutant. In this study, we further investigated the responses of AcR and wild-type ZM4 to sodium acetate stress in minimum media using both transcriptomics and a metabolic labeling approach for quantitative proteomics the first time. Proteomic measurements at two time points identified about eight hundreds proteins, or about half of the predicted proteome. Extracellular metabolite analysis indicated AcR overcame the acetate stress quicker than ZM4 with a concomitant earlier ethanol production in AcR mutant, although the final ethanol yields and cell densities were similar between two strains. Transcriptomic samples were analyzed for four time points and revealed that the response of Z. mobilis to sodium acetate stress is dynamic, complex, and involved about one-fifth of the total predicted genes from all different functional categories. The modest correlations between proteomic and transcriptomic data may suggest the involvement of posttranscriptional control. In addition, the transcriptomic data of forty-four microarrays from four experiments for ZM4 and AcR under different conditions were combined to identify strain-specific, media-responsive, growth phase-dependent, and treatment-responsive gene expression profiles. Together this study indicates that minimal medium has the most dramatic effect on gene expression compared to rich medium followed by growth phase, inhibitor, and strain background. Genes involved in protein biosynthesis, glycolysis and fermentation as well as ATP synthesis and stress response play key roles in Z. mobilis metabolism with consistently strong expression levels under different conditions.
Keywords: Zymomonas mobilis; acetate; microarray; pretreatment inhibitor; proteomics and metabolomics; quantitative proteomics; stress responses; systems biology.
Figures
References
-
- Almeida J. R. M., Modig T., Petersson A., Hahn-Hagerdal B., Liden G., Gorwa-Grauslund M. F. (2007). Increased tolerance and conversion of inhibitors in lignocellulosic hydrolysates by Saccharomyces cerevisiae. J. Chem. Tech. Biotech. 82, 340–349 10.1002/jctb.1676 - DOI
LinkOut - more resources
Full Text Sources
Other Literature Sources
Molecular Biology Databases