. 2014 May 16:5:222.
doi: 10.3389/fimmu.2014.00222. eCollection 2014.

Higher Expression of Activating Receptors on Cytotoxic NK Cells is Associated with Early Control on HIV-1C Multiplication

Affiliations

Higher Expression of Activating Receptors on Cytotoxic NK Cells is Associated with Early Control on HIV-1C Multiplication

Archana Gopal Kulkarni et al. Front Immunol. .

Abstract

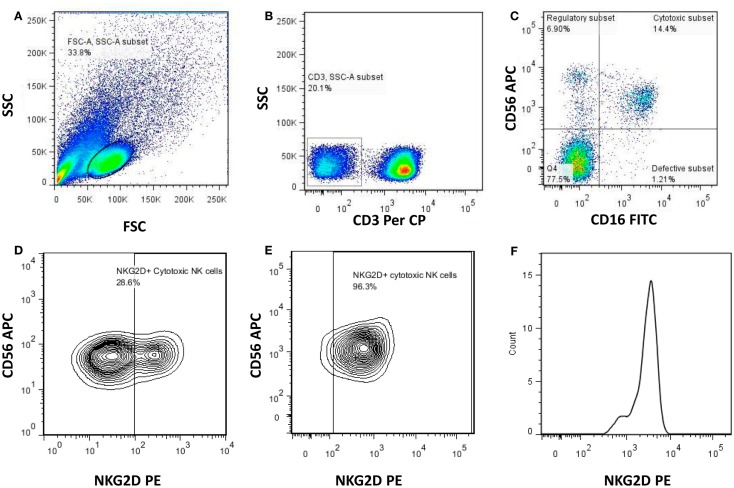
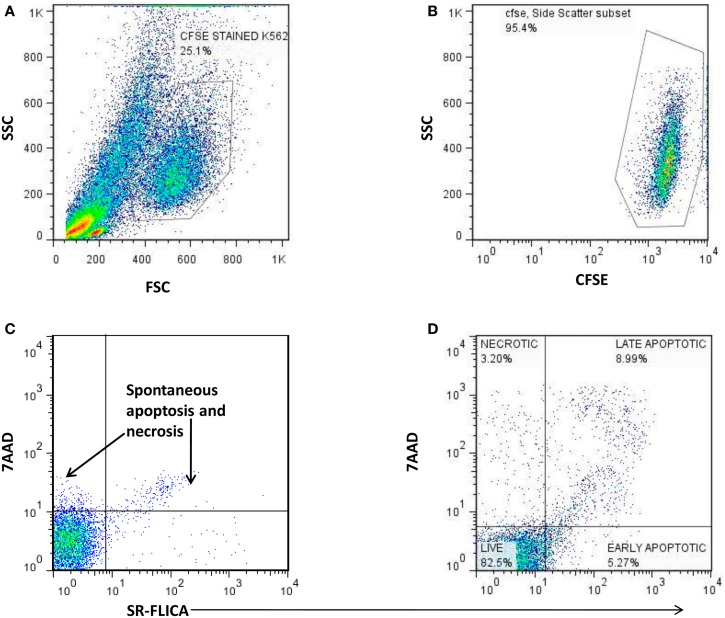
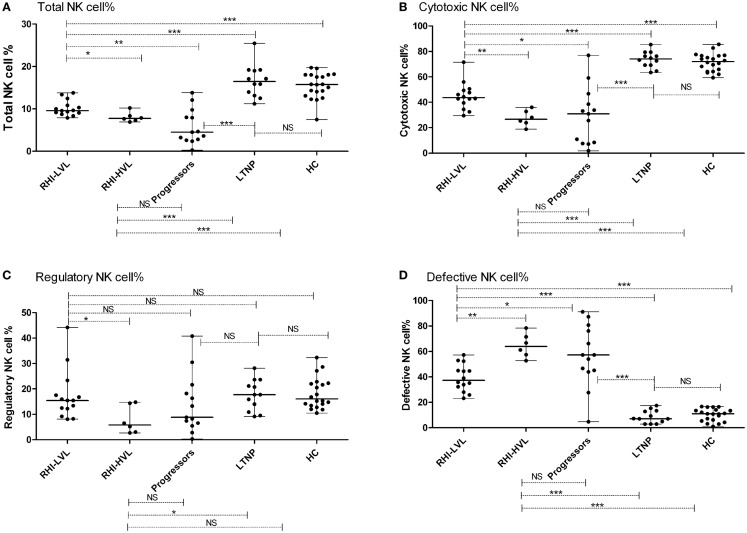
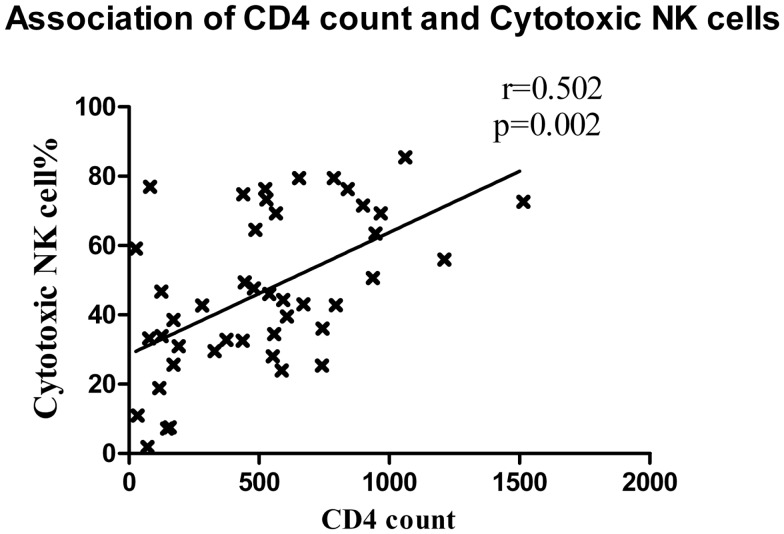
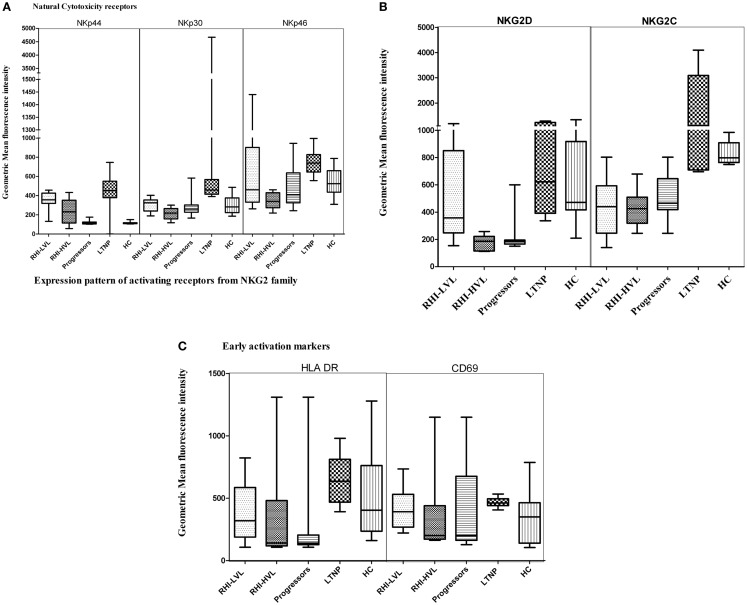
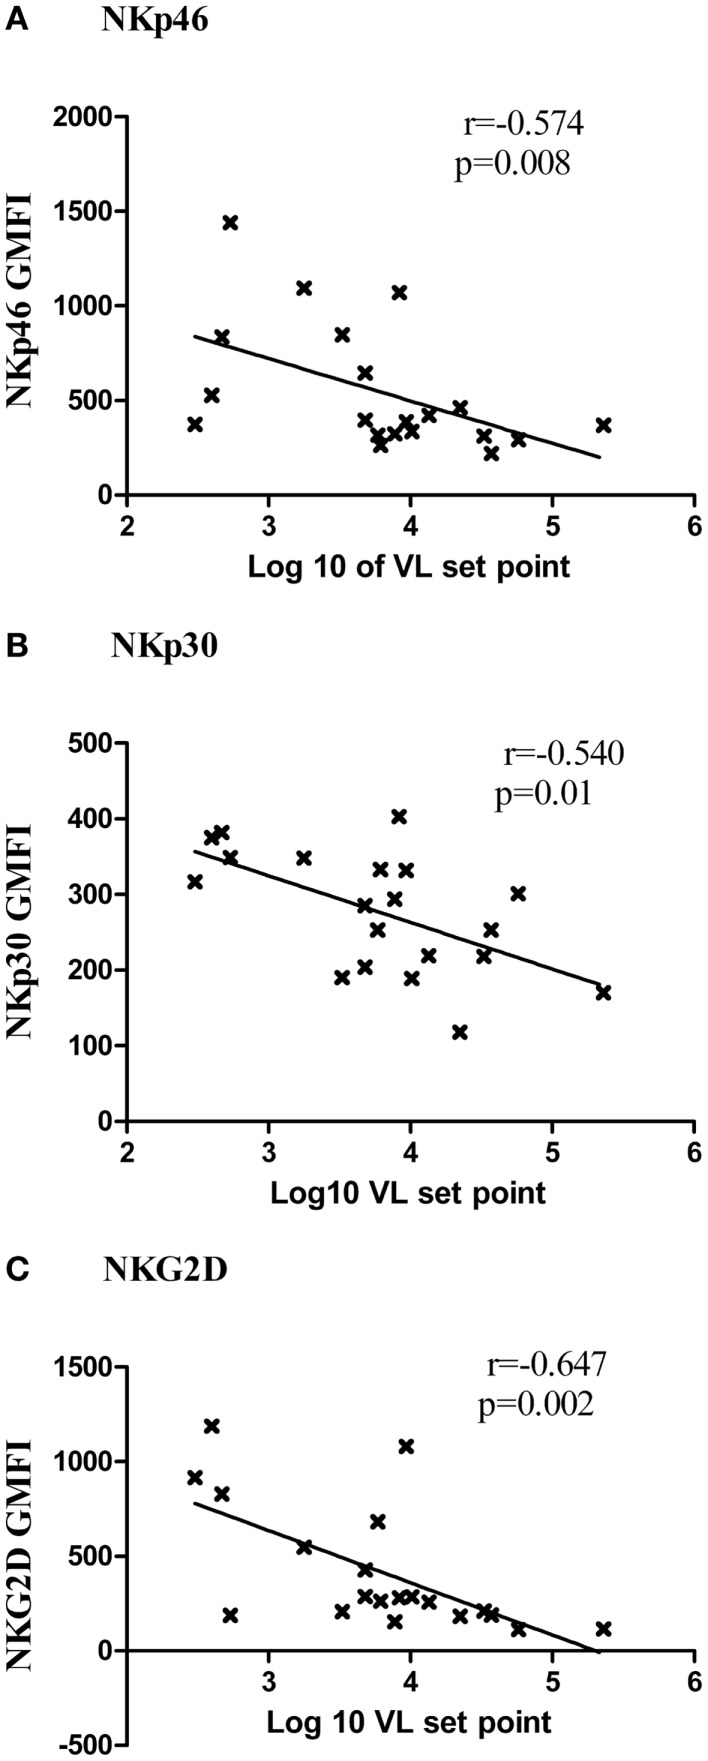
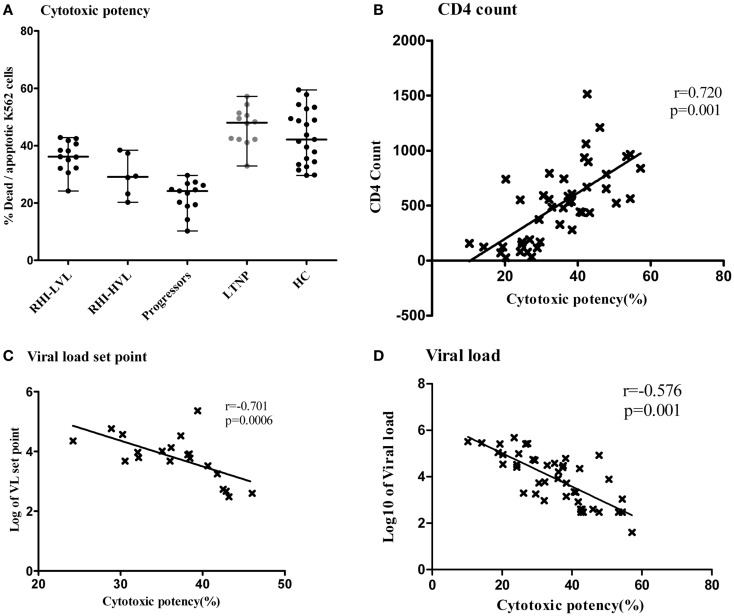
Natural killer (NK) cells may be important in modulating HIV replication in early course of HIV infection. The effector function of NK cells is finely tuned by a balance between signals delivered by activating and inhibitory receptors. However, the influence of expression of these receptors on the early course of HIV replication and subsequent disease progression is not explored in the context of HIV-1C infection. The expression pattern of activating (NKp46, NKp44, NKp30, NKG2D, and NKG2C) and inhibitory (CD158b, NKG2A, and ILT2) receptors was determined in 20 patients with recent HIV-1C infection within 3-7 months of acquiring HIV infection and was compared with the expression pattern in individuals with progressive (N = 12), non-progressive HIV-1C infection (LTNPs, N = 12) and healthy seronegative individuals (N = 20). The association of the expression of these receptors on the rate of disease progression was assessed using viral load set point of recently infected individuals as a marker of disease progression. The study showed that higher cytotoxic potency of NK cells was associated with low viral load set point in recent HIV infection (r = -0.701; p = 0.0006) and higher CD4 counts (r = 0.720; p = 0.001). The expression of activating receptors (NKp46, NKp30, and NKG2D) on cytotoxic NK cells but not on regulatory NK cells was also significantly associated with low viral set point (p < 0.01) and viral load in LTNPs and progressors (p < 0.01). The study also indicated that cytotoxic NK cells might show the ability to specifically lyse HIV infected CD4 cells. This data collectively showed that early and sustained higher expression of activating receptors on cytotoxic NK cells could be responsible for increased cytotoxicity, reduced viral burden, and thus delaying the disease progression. The study to identify the molecular mechanism of the expression of these receptors in HIV infection will be helpful in further understanding of NK cell mediated control in early HIV infection.

Keywords: HIV-1C; NK cell; activating receptors; cytotoxic potency; early phase; infection.


Figures

Figure 1
Figure 1
Gating strategy used to identify NK cells and the NK cell subsets. Representative flowcytometry plots from the PBMCs of one of the study participants. The lymphocytes were live gated during acquisition using the side and forward scatter dot plot display (A). Furthermore, by using the negative gating strategy, CD3-negative lymphocyte population was identified (B). The NK cell population was further identified and differentiated into regulatory (CD3CD16CD56+), cytotoxic (CD3CD16+CD56+), and defective (CD3CD16+CD56) NK cell subsets on the basis of the expression of CD56 and CD16 (C). Representative contour plot to demonstrate discrimination between positive and negative population for the presence of NK cell receptor (NKG2D) (RHI-HVL) (D). Representative contour plot to demonstrate discrimination between positive and negative population for the presence of NK cell receptor (NKG2D) (LTNP) (E). Representative histogram of positive population to denote histogram analysis of each of the NK cell subset to determine G-MFI of NK cell receptors (NKG2D) (F).
Figure 2
Figure 2
The scatter plots showing the gating strategy used to distinguish necrotic, late apoptotic, and early apoptotic K562cells (target) co-cultured with PBMCs as a source of NK cells (effector cells). (A) Identification of large sized K562 cells using the FSC and SSC parameter. (B) Detection of CFSE stained K562 cells. (C) Estimation of spontaneous lysis of K562 cells: (Negative control): CFSE stained K562 cells alone incubated for 4 h. (D) Lysis of CFSE stained K562 cells by the effector cells: 7AAD X axis) vs. SR-FLICA (Y axis) showing necrotic (7AAD+SR-FLICA: upper left quadrant), late apoptotic (7AAD+ SR-FLICA+: upper right quadrant), and early apoptotic cells (7AAD SR-FLICA+: lower right quadrant).
Figure 3
Figure 3
Total NK cell frequency and subset wise distribution in study participants. (A) Total NK cell %, (B) cytotoxic NK cell %, (C) regulatory NK cell %, and (D) defective NK cell %. *p < 0.05, **p < 0.01, ***p < 0.001, and NS, not significant.
Figure 4
Figure 4
Association between CD4 cell count and cytotoxic NK cells. The CD4 T cell counts of patients with recent HIV infection are plotted on X axis and the percentage of cytotoxic NK cells was plotted on Y axis.
Figure 5
Figure 5
Natural killer cell receptor profile of cytotoxic NK cells in HIV infection. (A) Natural cytotoxicity receptors (NKp44, NKp30, and NKp46), (B) activating receptors: NKG2D and NKG2C, and (C) early activation receptors HLA-DR and CD69.
Figure 6
Figure 6
Association of expression of activating receptors and viral load set point. The G-MFI of NKp46 (A), NKp30 (B), and NKG2D (C) is plotted on Y axis and the log of viral load set point is shown on the X axis.
Figure 7
Figure 7
Cytotoxic potency of NK cells in study participants. The vertical scatter plot shows the percentages of lysed target cells (Y axis) as a measure of cytotoxic potency of the NK cells from all the study groups (X axis). LTNPs showed highest cytotoxic potency (Dots are highlighted by gray color) (A). Association of cytotoxic potency of NK cells (X axis) with the markers of disease progression on y axis; the CD4 count (B) and the plasma viral load set point (C) and viral load at enrollment visit in HIV-1 infected study participants (D).

References

    1. Mogensen TH, Melchjorsen J, Larsen CS, Paludan SR. Innate immune recognition and activation during HIV infection. Retrovirology (2010) 7:54. 10.1186/1742-4690-7-54 - DOI - PMC - PubMed
    1. Borrow P. Innate immunity in acute HIV-1 infection. Curr Opin HIV AIDS (2011) 6:353–63 10.1097/COH.0b013e3283495996 - DOI - PMC - PubMed
    1. Lanier LL. NK cell recognition. Annu Rev Immunol (2005) 23:225–74 10.1146/annurev.immunol.23.021704.115526 - DOI - PubMed
    1. Michael T, Lotze AWT. Natural Killer Cells: Basic Science and Clinical Application. London: Academic Press; (2010).
    1. Naranbhai V, Altfeld M, Karim SS, Ndung’u T, Karim QA, Carr WH. Changes in natural killer cell activation and function during primary HIV-1 infection. PLoS One (2013) 8:e53251. 10.1371/journal.pone.0053251 - DOI - PMC - PubMed