. 2014 Jun 5;14(6):838-53.
doi: 10.1016/j.stem.2014.04.003.

Reorganization of enhancer patterns in transition from naive to primed pluripotency

Affiliations

Reorganization of enhancer patterns in transition from naive to primed pluripotency

Christa Buecker et al. Cell Stem Cell. .

Abstract

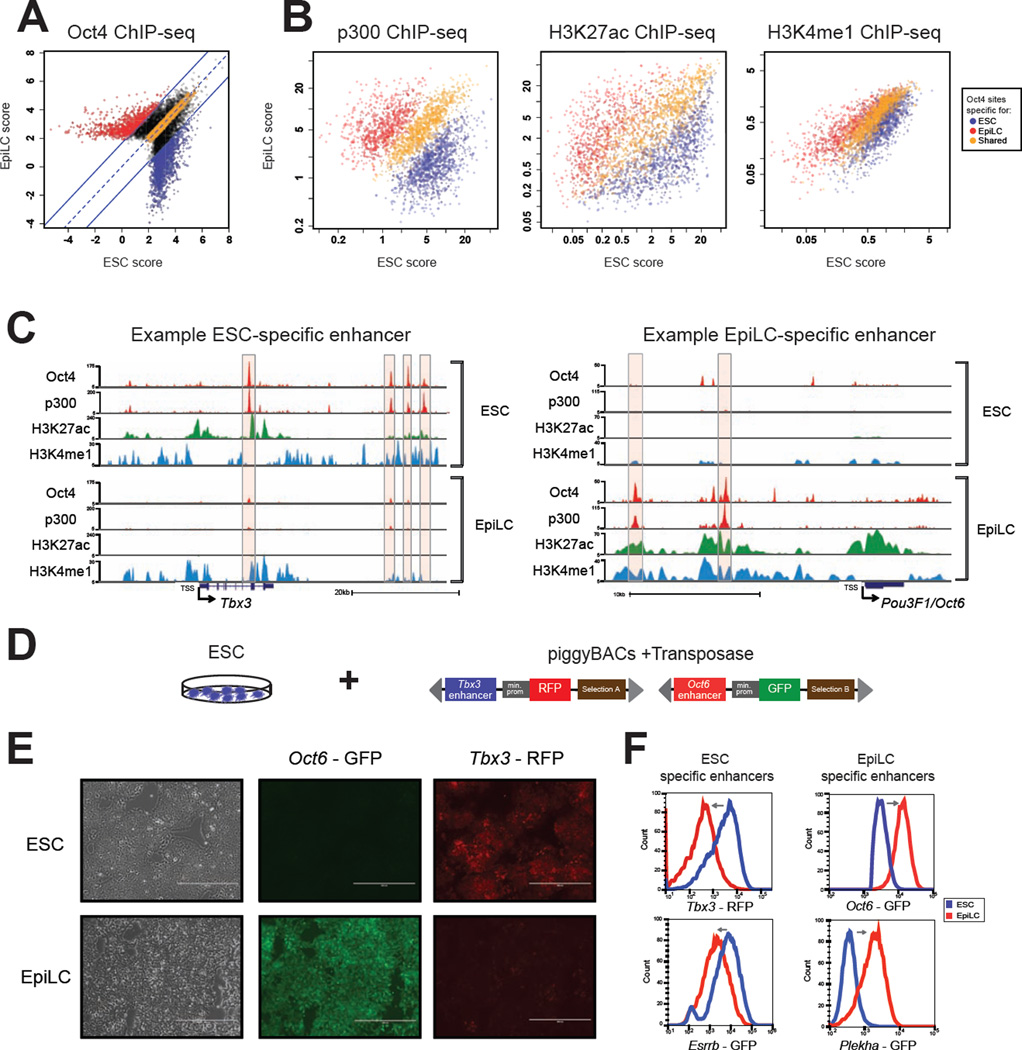
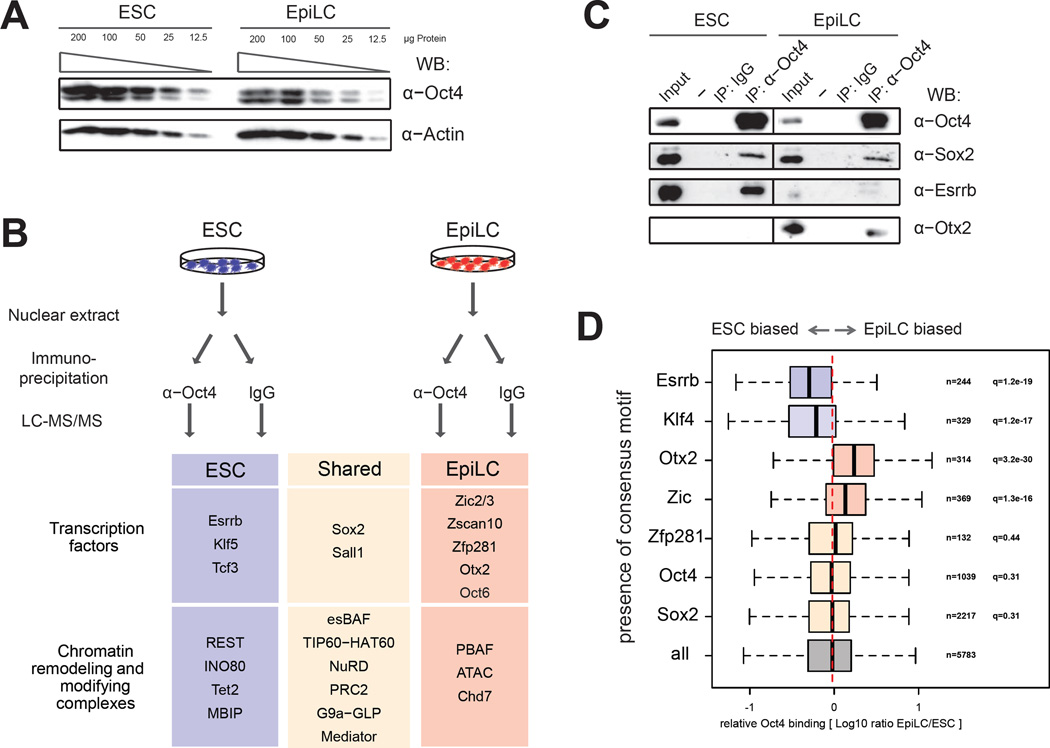
Naive and primed pluripotency is characterized by distinct signaling requirements, transcriptomes, and developmental properties, but both cellular states share key transcriptional regulators: Oct4, Sox2, and Nanog. Here, we demonstrate that transition between these two pluripotent states is associated with widespread Oct4 relocalization, mirrored by global rearrangement of enhancer chromatin landscapes. Our genomic and biochemical analyses identified candidate mediators of primed state-specific Oct4 binding, including Otx2 and Zic2/3. Even when differentiation cues are blocked, premature Otx2 overexpression is sufficient to exit the naive state, induce transcription of a substantial subset of primed pluripotency-associated genes, and redirect Oct4 to previously inaccessible enhancer sites. However, the ability of Otx2 to engage new enhancer regions is determined by its levels, cis-encoded properties of the sites, and the signaling environment. Our results illuminate regulatory mechanisms underlying pluripotency and suggest that the capacity of transcription factors such as Otx2 and Oct4 to pioneer new enhancer sites is highly context dependent.


Figures

Figure 1
Figure 1. Widespread relocalization of Oct4 during ESC to EpiLC transition
(A) ESC to EpiLC transition. Upper panel depicts corresponding cell fate change in vivo, lower panel shows morphology changes during 48h of in vitro differentiation. (B) Transcriptome changes during ESC to EpiLC transition. Each point represents FPKM values obtained for a given transcript in RNA-seq analysis from ESCs (ordinate) or EpiLC (abscissa). For clarity, only transcripts, which tested positive for differential expression by cuffdiff are plotted (FDR<0.05, exceptions are Oct4 and Sox2). Selected transcripts known to be associated with naive pluripotency are highlighted in blue, those associated with post-implantation epiblast are highlighted in red, and general pluripotency factors are shown in orange. (C) Expression of pre- or post- primitive streak epiblast markers in EpiLCs and EpiSCs. Stage-specific genes were selected from Kojima et al., 2013. FPKM values from EpiLCs (red) and EpiSCs (green) RNA-seq experiments are shown for each representative gene. For additional genes see Figure S2B. (D) Oct4 ChIP-seq signal reproducibility and variation in ESCs and EpiLCs. Oct4 ChIP-seq was performed from two biological replicates of ESCs and from EpiLCs derived with and without the addition of exogenous Activin A. A set of 5783 Oct4 sites was selected for further analysis, representing the union of top 3250 ranked sites in each of the four ChIP-seq samples. These sites will hereafter be referred to as "top Oct4 sites". Plotted are peak KDE values for each of the top Oct4 sites (see also Extended Experimental Procedures). (E) Changes in Oct4 binding are positively correlated with changes in gene expression. Plotted are histograms of fold expression changes for transcripts that tested as significant in the ESC to EpiLC differentiation (cuffdiff, Figure 1B). We used default GREAT association rules to identify genes (usually two) in proximity of Oct4 sites. Oct4 sites defined as unchanged are associated with genes with no net transcriptional difference, while genes associated with EpiLC-specific sites show significant (Wilcoxon U test) net upregulation in EpiLCs. Opposite trend is seen for the ESC-specific Oct4 sites. Three classes of Oct4 sites were defined as shown in Figure 2A. See also Figure S1 and S2.
Figure 2
Figure 2. Changes in enhancer chromatin patterns mirror Oct4 reorganization
(A) Oct4 sites were classified based on change in Oct4 occupancy during differentiation. We estimated FDR based on biological repeats and chosen FDR <0.003 to define ESC-specific sites (blue) and EpiLC-specific sites (red). Least changed sites (orange) were treated as shared. (B) Changes in p300 occupancy, H3K27ac modification and to lesser extent H3K4me1 modification follow changes in Oct4 occupancy. Plotted are mean peak ChIP-seq KDE values of the respective ChIP-seq signals from ESC (ordinate) or EpiLC (abscissa) at three classes of Oct4 sites defined in (A). (C) Genome browser representation of QuEST-generated ChIP-seq profiles from ESCs (upper panels) or EpiLCs (lower panels) at a locus representing ESC-specific Oct4 binding (Tbx3, left) or EpiLC-specific Oct4 binding (Oct6, right). (D) Schematics of the piggyBac transposon-based enhancer-reporter system used to create dual reporter lines: each enhancer was cloned upstream of the minimal TK promoter driving expression of a different fluorescent protein, coupled to a distinct selection cassette. (E) Changes in reporter activity during differentiation. Representative fluorescent microscopy images of a clonal cell line containing the Oct6 locus enhancer driving GFP expression and the Tbx3 locus enhancer driving RFP expression. ESC to EpiLC differentiation was carried out for 48h. (F) Quantification of reporter cell lines described in Figure 2E and two additional cell lines by flow cytometry. See also Figure S3.
Figure 3
Figure 3. Identification of candidate Oct4 cooperating TFs
(A) Oct4 protein levels in ESCs and EpiLCs. Anti-Oct4 Western blot of a twofold serial dilution of whole cell extract from ESCs (left) or EpiLCs (right). Actin was used as a loading control. (B) Schematic representation of LC-MS/MS identification of Oct4-associated proteins. Relevant interaction partners are listed. For full results see Table S2. (C) Validation of Oct4 association with selected partners by IP-Western in an independent experiment. (D) Oct4 sites that contain nearby consensus motif for Esrrb or Klf4/5 are bound more strongly in ESCs, whereas sites with Otx2 or Zic motif are bound more strongly in EpiLCs. A set of top 5783 Oct4 sites was classified based on the presence of the consensus recognition motifs for candidate TFs. Analysis required that the analyzed TF consensus motif lies within a very short distance (+/− 50bp) from the center of the respective Oct4 ChIP-seq peak. Ratios of EpiLC to ESC Oct4 ChIP enrichments at such sites were calculated and represented as boxplots. See also Figure S4
Figure 4
Figure 4. Coordinated changes in Otx2 and Oct4 binding during differentiation
(A) Changes in Otx2 levels during the ESC to EpiLC transition. Otx2 mRNA levels were analyzed by RT-qPCR in ESCs and EpiLCs (left panel, signals were normalized to Rpl13a, compare to Fgf5 and Esrrb levels). Error bars indicate SD of three technical qPCR replicates of one representative experiment. Protein levels we analyzed by quantitative Western blotting (right panel) using Licor. An antibody against Tbp was used as a loading control. (B) Changes in Otx2 occupancy during differentiation. Plotted are peak KDE values of Otx2 ChIP-seq signals from ESCs and EpiLCs. We chose FDR cutoff 0.003 to define 948 ESC specific sites (blue) and 2180 EpiLC specific sites (red). 2000 least changed sites (orange) were treated as shared. (C) Changes in p300 occupancy, H3K27ac modification and, to a lesser extent, H3K4me1 modification correlate with changes in Otx2 binding. Plotted are peak KDE values of the respective ChIP-seq signals at Otx2 sites as defined and color coded as in (B). (D) Oct4 and Otx2 ChIP-seq signals in EpiLCs (left panel), as well as fold changes in binding intensity during ESC to EpiLC transition are plotted. R is Spearman correlation coefficient. (E) EpiLC-specific Otx2 sites are enriched for the Otx2 motif, whereas ESC-specific Otx2 sites are enriched for the CTCF motif. Genomic regions ±1 kb relative to the Otx2 ChIP-seq signal peak position at top 948 Otx2 sites of each class were scanned with FIMO (part of the MEME suite Bailey et al., 2009; Grant et al., 2011) using PWM derived from Jolma et al., 2013. Kernel smoothed aggregate score (−log(p.value)) is plotted. (F) Aggregate plot of FAIRE-seq signal from ESC (left) or EpiLC (right) over the ESC-specific (blue) or EpiLC-specific (red) Otx2 sites defined as in (B). Plotted are kernel smoothed normalized counts of FAIRE-seq tags relative to Otx2 ChIP peaks in each Otx2 class (reads per kb per 100,000 reads, kernel bandwidth 100bp). (G) Aggregate plot of DNase-seq signal from ESCs grown under 2i+LIF conditions at Otx2 sites specific for ESC (blue) or EpiLC (red) defined as in D. See also Figure S5.
Figure 5
Figure 5. Effects of loss or gain of Otx2 on EpiLC gene expression program
(A) RT-qPCR analysis of gene expression changes in wt and Otx2−/− ESCs and EpiLCs. Differentiation was carried out for 48h, cDNA levels were normalized against Rpl13a and analyzed transcripts are indicated on top. Error bars indicate SD of three technical replicates from a representative experiment. (B) Loss of Otx2 affects a subset of genes induced during the ESC to EpiLC transition. RNA-seq transcriptome of Otx2−/− EpiLCs was compared to EpiLCs obtained from a matched wt cell line. Highlighted in red are transcripts that have statistically significant induction of expression during the differentiation from ESC to EpiLC in a wt background (compare to Figure 1B). (C) Schematic representation of the inducible Otx2 overexpression system. (D) Morphological changes upon Otx2 overexpression in ESCs are reminiscent of those observed in EpiLCs. Otx2−/− cells reconstituted with inducible Otx2 (Otx2−/−+ tetOn Otx2) and grown under 2i+LIF were treated with 2µg/ml doxycycline for 48h. Morphology was compared to non-induced cells. (E) Transcripts affected by Otx2 overexpression are also differentially expressed during ESC to EpiLC transition. RNA-seq from tetON Otx2 cells grown in the absence (X axis) or presence for 26h (Y axis) of Dox were compared and expression values (FPKM) of all significantly changed (FDR<0.01, cuffdiff) transcripts were plotted. Those transcripts that were also significantly upregulated or downregulated during the ESC to EpiLC transition are highlighted in red or blue, respectively. (F) Otx2 overexpression recapitulates a substantial subset of gene expression changes that occur during the ESC to EpiLC transition. Each point represents FPKM values obtained for a given transcript by RNA-seq analysis from ESCs (X axis) or EpiLC (Y axis). For clarity, only transcripts, which tested positive for differential expression by cuffdiff are plotted (FDR<0.01). Those transcripts that were also significantly upregulated or downregulated upon Otx2 overexpression are highlighted in red or blue, respectively. (G) RNA-seq transcriptome data from ESC vs EpiLC were plotted similar to Figure 1B but marked in red (blue) are transcripts significantly upregulated (downregulated) by overexpression of Otx2. (H) Quantitative comparisons of expression changes during EpiLC formation and Otx2 overexpression. We identified ~2200 genes that undergo significant expression change during ESC->EpiLC transition and are either upregulated (red) or downregulated (blue). Next we plotted expression change for these genes in RNAseq from independent repeat of differentiation in wild-type (left) and Otx2−/− cells with induced overexpression of Otx2 (right) See also Figure S6
Figure 6
Figure 6. Sensitivity of the Fgf5 locus enhancer cluster to Otx2 perturbations
(A) Enhancer activation at the Fgf5 locus. Genome browser representation of ChIP-seq tracks for Otx2, Oct4, p300, H3K27ac and H3K4me1 in ESCs (upper part) and EpiLC (lower part) at the Fgf5 locus. DNase-seq track from ESCs grown under 2i+LIF (data from ENCODE Project Consortium, 2011) is shown at the bottom. Highlighted are promoter-proximal poised enhancer (PE) and a cluster of four enhancers (E1-E4) activated de novo. (B) ChIP-qPCR analyses of the Fgf5 locus enhancers from wt or Otx2−/− ESCs and EpiLCs were carried out with indicated antibodies. % input recovery was calculated and normalized to the average of two negative regions. Error bars indicate SD of three technical qPCR replicates from a representative experiment. (C) Selective activation of the E2 enhancer upon Otx2 overexpression. ChIP-qPCR analyses from Otx2−/− ESCs and Otx2−/−+ tetOn Otx2 cells grown in the absence or presence of Dox, were carried out with indicated antibodies. % input recovery was calculated and normalized to the average of two negative regions. Error bars indicate SD of three technical qPCR replicates from a representative experiment.
Figure 7
Figure 7. Otx2 overexpression leads to global reorganization of Oct4 binding pattern
(A) Otx2 and Oct4 binding at the Fgf5 locus upon Otx2 overexpression. Genome browser representation of ChIP-seq tracks for Otx2 and Oct4 in EpiLCs (upper rows), in tetON Otx2 cells that were uninduced (middle rows) or induced (bottom rows) with Dox. (B) Fold changes in Otx2 ChIP-seq binding signals during overexpression (X axis) and during ESC to EpiLC transition (Y axis) were plotted at each of the top Otx2 sites (defined by absolute signal). Three classes of Otx2 sites were classified as follows: (i) purple- EpiLC only (sites induced in EpiLCs >3.5x and in Dox <0.66x), (ii) yellow -EpiLC and OE (sites induced in both >3.5x and >3x fold, respectively), (iii) cyan –OE only (sites induced in Dox >3x with <2x change in EpiLC). (C) Oct4 binding follows Otx2. Left panel: Plotted are KDE values of the respective Oct4 ChIP-seq signals from uninduced (X axis) and induced (Y axis) tetON Otx2 cells. Right panel: Plotted are fold changes in Oct4 binding upon Otx2 overexpression (X axis) and during ESC to EpiLC transition (Y axis). Each dot represents Otx2 site defined and color-coded as in (B). (D) Sites bound by Otx2 upon overexpression are nucleosome-occupied in ESCs. Aggregate plots of ESC FAIRE-seq signals over: the EpiLC only (purple), EpiLC and Otx2 OE (yellow) and Otx2 only (cyan) sites defined as in (B). For a relative comparison, aggregate plot of FAIRE-seq signals over ESC specific Oct4 sites is also shown (dotted grey line). Plotted are kernel smoothed normalized counts of FAIRE tags relative to Otx2 ChIP peaks in each Otx2 class (reads per kb per 100,000 reads, kernel bandwidth 100bp). (E) Otx2 binding upon overexpression is guided by inherent genetic determinants. Genomic regions ±1 kb relative to the Otx2 ChIP-seq signal peak position at top Otx2 sites of each class were scanned for presence of indicated motifs, as described for Figure 4E. (F) Model for cooperative enhancer selection during ESC to EpiLC transition. See discussion for further description. See also Figure S7.

References

    1. Acampora D, Di Giovannantonio LG, Simeone A. Otx2 is an intrinsic determinant of the embryonic stem cell state and is required for transition to a stable epiblast stem cell condition. Dev. Camb. Engl. 2013;140:43–55. - PubMed
    1. Bailey TL, Boden M, Buske FA, Frith M, Grant CE, Clementi L, Ren J, Li WW, Noble WS. MEME Suite: tools for motif discovery and searching. Nucleic Acids Res. 2009;37:W202–W208. - PMC - PubMed
    1. Van den Berg DLC, Snoek T, Mullin NP, Yates A, Bezstarosti K, Demmers J, Chambers I, Poot RA. An Oct4-Centered Protein Interaction Network in Embryonic Stem Cells. Cell Stem Cell. 2010;6:369–381. - PMC - PubMed
    1. Betschinger J, Nichols J, Dietmann S, Corrin PD, Paddison PJ, Smith A. Exit from pluripotency is gated by intracellular redistribution of the bHLH transcription factor Tfe3. Cell. 2013;153:335–347. - PMC - PubMed
    1. Boiani M, Schöler HR. Regulatory networks in embryo-derived pluripotent stem cells. Nat. Rev. Mol. Cell Biol. 2005;6:872–884. - PubMed

Publication types

MeSH terms

Substances

Associated data