Comparative Study
. 2014 Jun 5;14(6):854-63.
doi: 10.1016/j.stem.2014.05.005.

Epigenomic comparison reveals activation of "seed" enhancers during transition from naive to primed pluripotency

Affiliations
Comparative Study

Epigenomic comparison reveals activation of "seed" enhancers during transition from naive to primed pluripotency

Daniel C Factor et al. Cell Stem Cell. .

Abstract

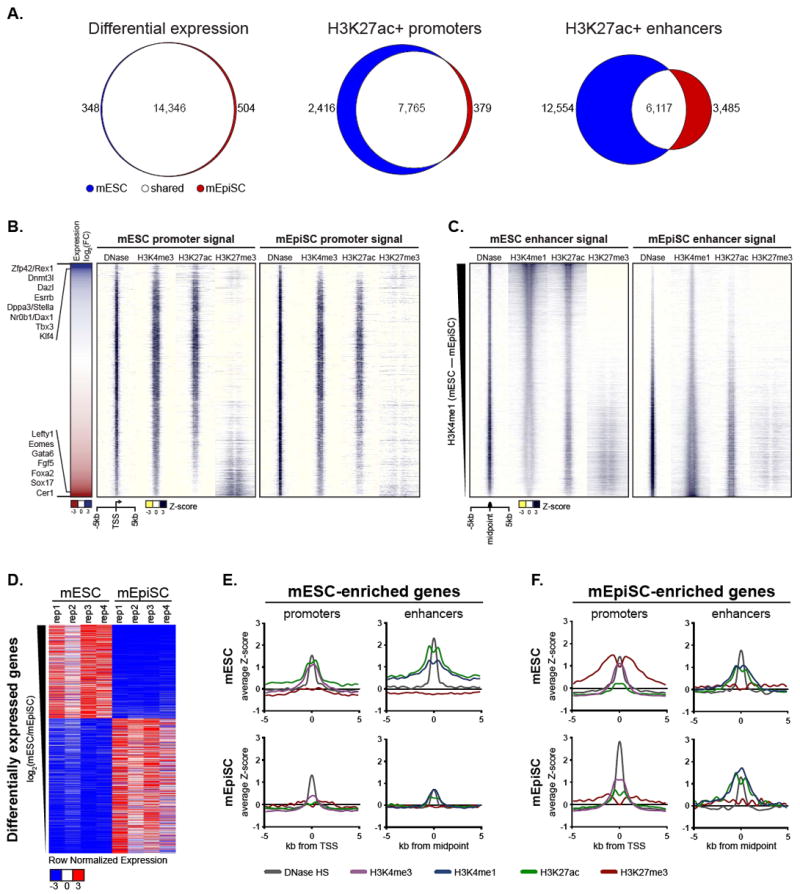
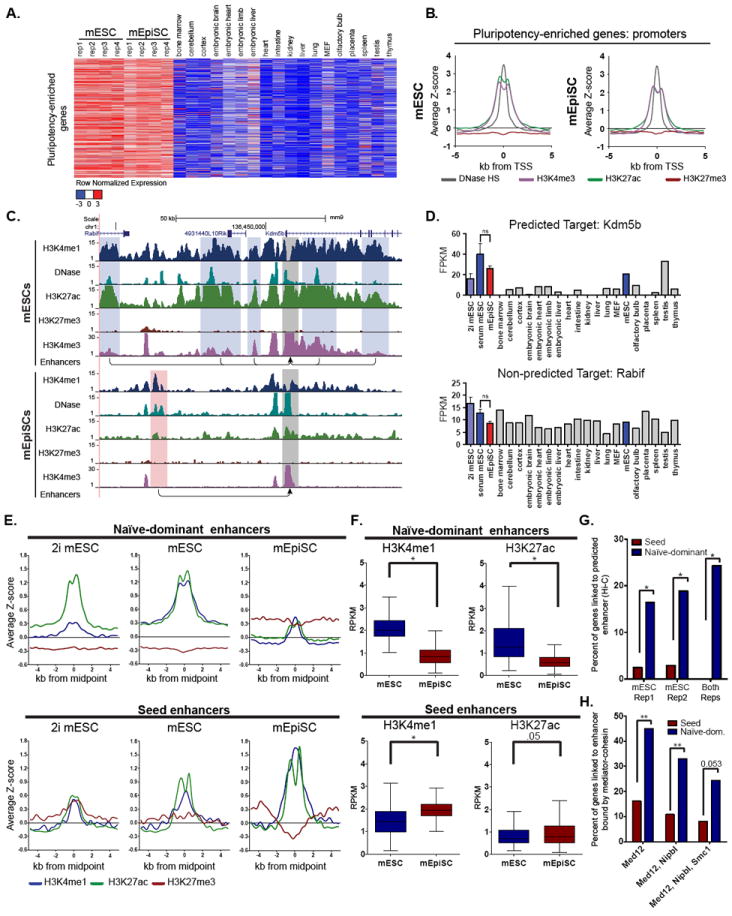
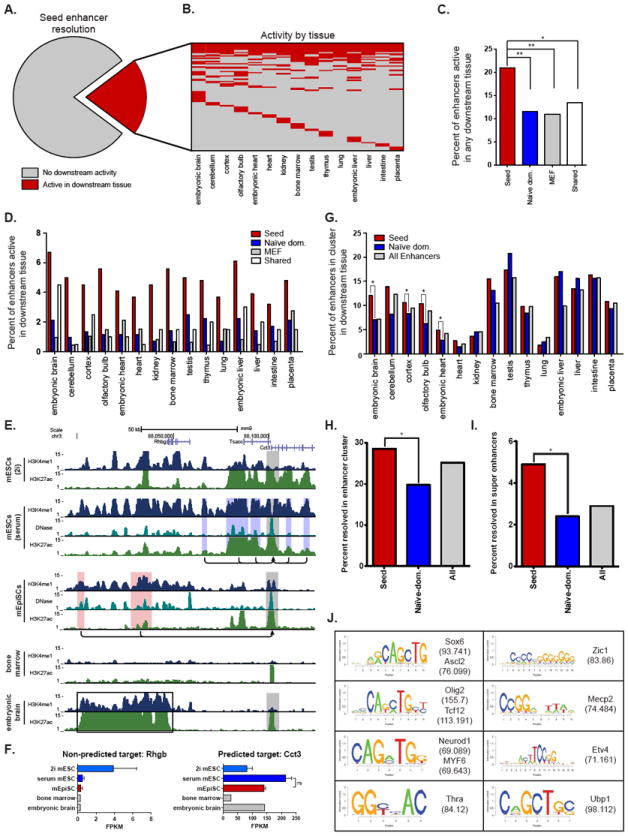
Naive mouse embryonic stem cells (mESCs) and primed epiblast stem cells (mEpiSCs) represent successive snapshots of pluripotency during embryogenesis. Using transcriptomic and epigenomic mapping we show that a small fraction of transcripts are differentially expressed between mESCs and mEpiSCs and that these genes show expected changes in chromatin at their promoters and enhancers. Unexpectedly, the cis-regulatory circuitry of genes that are expressed at identical levels between these cell states also differs dramatically. In mESCs, these genes are associated with dominant proximal enhancers and dormant distal enhancers, which we term seed enhancers. In mEpiSCs, the naive-dominant enhancers are lost, and the seed enhancers take up primary transcriptional control. Seed enhancers have increased sequence conservation and show preferential usage in downstream somatic tissues, often expanding into super enhancers. We propose that seed enhancers ensure proper enhancer utilization and transcriptional fidelity as mammalian cells transition from naive pluripotency to a somatic regulatory program.


Conflict of interest statement

CONFLICT OF INTEREST STATEMENT

All authors declare no competing financial interests.

Figures

Figure 1
Figure 1. Enhancer profiles distinguish mouse pluripotent states
(A) Venn diagrams showing the number and overlap of expressed transcripts (left), H3K27ac+ promoters of expressed genes (center), and H3K27ac+ enhancers (right) detected in mESCs and mEpiSCs (B) Heatmap of expression differences between mESC and mEpiSC (log2 transformed, average of mESC replicates / average of mEpiSC replicates) ranked from high to low (left). Known mESC- and mEpiSC-enriched genes are listed to the left. Windowed chromatin heatmaps comparing DNase HS, H3K4me3, H3K27ac and H3K27me3 profiles ± 5kb of promoters in mESC and mEpiSC ranked in the same order as expression data (right). (C) Windowed heatmaps contrasting DNase HS, H3K4me1, H3K27ac, and H3K27me3 signal ± 5kb from the midpoint of DNase-centered putative enhancers identified in mESC or mEpiSC. Enhancers are ranked from most to least mESC-specific (compared to mEpiSCs) based on H3K4me1 peak intensities. (D) Row normalized expression of transcripts differentially expressed (also denoted as enriched) between mESC and mEpiSC, ranked as in B. (E) Aggregate plots depicting average ChIP-seq and DNase-seq signals at promoters and enhancers of mESC-enriched genes in mESCs and mEpiSCs (F) Same as E, but for mEpiSC-enriched genes. See also Figure S1 and Tables S1 and S2.
Figure 2
Figure 2. Pluripotency-enriched genes show dramatic enhancer differences between pluripotent states
(A) Heatmap depicting row normalized expression of pluripotency-enriched genes. These genes are not differentially expressed (p-value>0.05), have <2-fold change between mESCs and mEpiSCs, and are relatively specific to mESCs and mEpiSCs compared in downstream tissues (see Methods). (B) Aggregate plots of DNase hypersensitivity and histone marks at the promoters of pluripotency-enriched genes (depicted in (A)), in mESC (left) and mEpiSC (right). (C) UCSC Browser image depicting the Kdm5b locus and the naïve-dominant enhancers (highlighted in blue) predicted to regulate its expression in mESC and the seed enhancers (highlighted in red) predicted to regulate its expression in mEpiSCs using the PreSTIGEouse methodology (see Methods). Grey boxes identify the Kdm5b promoter. The Rabif gene was not predicted to be regulated by these enhancers. (D) Expression levels (mean ± SD) of pluripotency-enriched transcript Kdm5b (top), and non-pluripotency-enriched transcript Rabif (bottom) in indicated cell types. (E) Aggregate plots of enhancers associated with the pluripotency-enriched genes. Naïve-dominant enhancers are predicted to regulate expression of pluripotency-enriched genes in the mESC state, but not in the mEpiSC state. Seed enhancers are predicted to regulate pluripotency-enriched genes in mEpiSCs, but not in mESCs. mESCs grown in standard conditions and 2i conditions are shown. (F) Boxplots depicting differences in the levels of enhancer histone marks between the two cell types as measured by RPKM (reads per kilobase per million mapped reads) at naïve-dominant enhancers (top) and seed enhancers (bottom) (paired sample Wilcoxon signed rank test, *p-value<0.0001). (G) Percentage of pluripotency-enriched genes associated with naïve-dominant enhancers and seed enhancers in mESC Hi-C datasets (Fisher’s Exact Test, *p-value<0.002). (H) Percentage of pluripotency-enriched genes for which both the gene target and an associated enhancer are bound by subunits of the mediator-cohesin complex (Med12, Nipbl, Smc1) (Fischer’s Exact Test, **p-value<0.0001). See also Figures S2 and S3.
Figure 3
Figure 3. Seed enhancers are utilized in downstream tissues where they expand into multi-enhancer clusters
(A) Pie chart depicting the fraction of seed enhancers that show a chromatin state indicative of enhancer activity (H3K27ac+) in downstream tissues (red). (B) Heatmap displaying the downstream tissues in which each seed enhancer is active. Each row represents a seed enhancer. Red denotes that the enhancer displays H3K27ac signal intensity above threshold in the given cell type. (C) Percentage of seed enhancers (red) active in at least one downstream tissue compared to naïve-dominant enhancers (blue), MEF enhancers (grey), and enhancers shared between mESC and mEpiSC (white) (Fisher’s Exact Test, *p-value<0.03, **<0.0001). MEF datasets here provide an approximate measure of the background level of enhancer utilization. (D) Percent of seed enhancers active in each downstream tissue (red) compared to naïve-dominant (blue), MEF (grey) and enhancers common to mESC and mEpiSC (shared; white). (E) Genome browser image depicting the Cct3 gene and the enhancers predicted to regulate its transcription in mESCs and mEpiSCs. Grey boxes demarcate active promoters, while blue boxes identify naïve-dominant enhancers. The red boxes highlight two seed enhancers, which become components of a super enhancer in embryonic brain (black box), but not bone marrow. (F) Expression (mean ± SD) of Cct3 (right) is high in pluripotent cells and embryonic brain, but low in bone marrow. None of the enhancers in this region are predicted to target neighboring gene Rhbg (left). (G) Percent of enhancers located in a cluster of enhancers (defined as 4 or more active enhancer elements within a 100-kb window) in a downstream tissue. Seed enhancers (red) are significantly more likely to occur in enhancer clusters than naïve-dominant enhancers (blue) in embryonic brain, cortex, olfactory bulb, and embryonic heart (Fisher’s Exact Test, *p-value<0.003). The background rate for all mESC and mEpiSC enhancers (grey) is included for comparison. (H) Percentage of seed enhancers (red), naïve-dominant enhancers (blue) and all enhancers (grey) within a region that becomes an enhancer cluster (defined as in G) in one of the four neural tissues in the panel (embryonic brain, cortex, olfactory bulb, and cerebellum; Fisher’s Exact Test, *p-value<0.003). (I) As in H, but for regions that are super enhancers in neural tissues. (J) Motifs enriched amongst seed enhancers that are active in downstream tissues. See also Table S3.

References

    1. Bradley A, Evans M, Kaufman MH, Robertson E. Formation of germ-line chimaeras from embryo-derived teratocarcinoma cell lines. Nature. 1984;309:255–256. - PubMed
    1. Brons IG, Smithers LE, Trotter MW, Rugg-Gunn P, Sun B, Chuva de Sousa Lopes SM, Howlett SK, Clarkson A, Ahrlund-Richter L, Pedersen RA, et al. Derivation of pluripotent epiblast stem cells from mammalian embryos. Nature. 2007;448:191–195. - PubMed
    1. Buecker C, Srinivasan R, Wu Z, Calo E, Acampora D, Faial T, Simeone A, Tan M, Swigut T, Wysocka J. Reorganization of enhancer patterns in transition from naïve to primed pluripotency. Cell stem cell. 2014;14 - PMC - PubMed
    1. Chan YS, Goke J, Ng JH, Lu X, Gonzales KA, Tan CP, Tng WQ, Hong ZZ, Lim YS, Ng HH. Induction of a human pluripotent state with distinct regulatory circuitry that resembles preimplantation epiblast. Cell stem cell. 2013;13:663–675. - PubMed
    1. Chenoweth JG, McKay RD, Tesar PJ. Epiblast stem cells contribute new insight into pluripotency and gastrulation. Dev Growth Differ. 2010;52:293–301. - PubMed

Publication types

MeSH terms

Associated data