

Is a coded physical activity diary valid for assessing physical activity level and energy expenditure in stroke patients?
- PMID: 24905345
- PMCID: PMC4048313
- DOI: 10.1371/journal.pone.0098735
Is a coded physical activity diary valid for assessing physical activity level and energy expenditure in stroke patients?
Abstract
Objectives: to determine the concurrent validity of a physical activity diary for measuring physical activity level and total energy expenditure in hospitalized stroke patients.
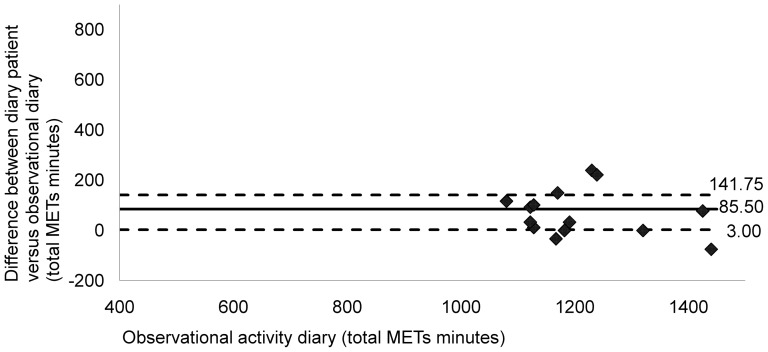
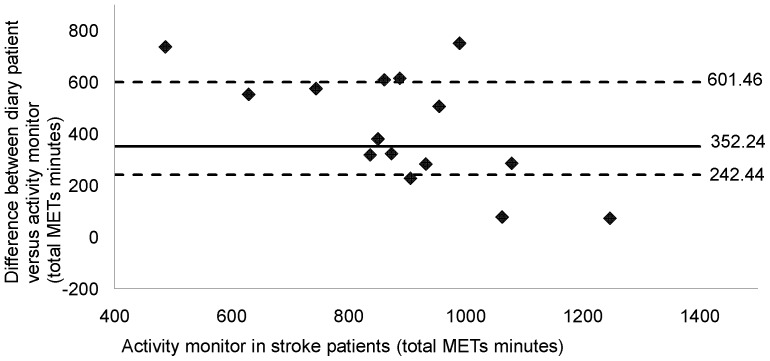
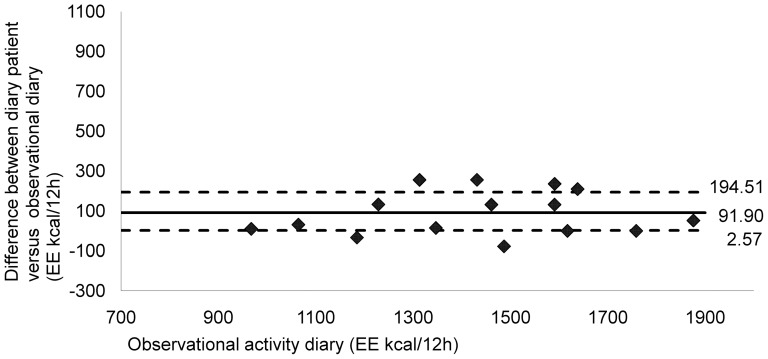
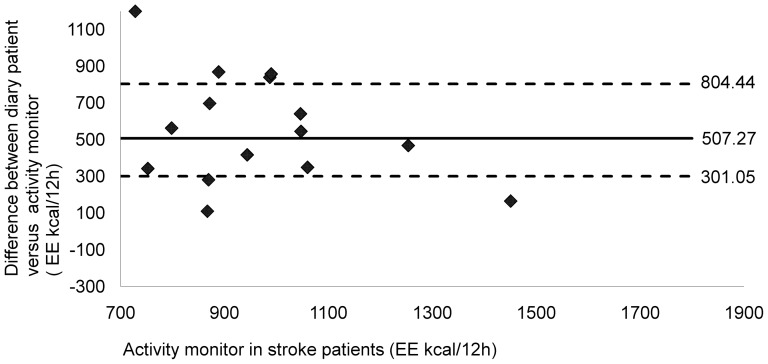
Method: Sixteen stroke patients kept coded activity diaries and wore SenseWear Pro2 multi-sensor activity monitors during daytime hours for one day. A researcher observed the patients and completed a diary. Data from the patients' diaries were compared with observed and measured data to determine total activity (METs*minutes), activity level and total energy expenditure.
Results: Spearman correlations between the patients' and researchers' diaries revealed a high correlation for total METs*minutes (rs = 0.75, p<0.01) for sedentary (rs = 0.74,p<0.01) and moderate activities (rs = 0.71,p<0.01) and a very high correlation (rs = 0.92, p<0.01) for the total energy expenditure. Comparisons between the patients' diaries and activity monitor data revealed a low correlation (rs 0.29) for total METs*minutes and energy expenditure.
Conclusion: Coded self-monitoring activity diaries appear feasible as a low-tech alternative to labor-intensive observational diaries for determining sedentary, moderate, and total physical activity and for quantifying energy expenditure in hospitalized stroke patients. Given the poor correlation with objective measurements of physical activity, however, further research is needed to validate its use against a gold-standard measure of physical activity intensity and energy expenditure.
Conflict of interest statement
Figures
References
-
- Hamilton MT, Hamilton DG, Zderic TW (2007) Role of low energy expenditure and sitting in obesity, metabolic syndrome, type 2 diabetes, and cardiovascular disease. Diabetes 56: 2655–2667. - PubMed
-
- Wendel-Vos GC, Schuit AJ, Feskens EJ, Boshuizen HC, Verschuren WM, et al. (2004) Physical activity and stroke. A meta-analysis of observational data. Int J Epidemiol 33: 787–798. - PubMed
-
- De Wit L, Putman K, Dejaeger E, Baert I, Berman P, et al. (2005) Use of time by stroke patients: a comparison of four European rehabilitation centers. Stroke 36: 1977–1983. - PubMed
-
- Alzahrani MA, Ada L, Dean CM (2011) Duration of physical activity is normal but frequency is reduced after stroke: an observational study. Journal of physiotherapy 57: 47–51. - PubMed
-
- Green LB (2007) Assessment of habitual physical activity and paretic arm mobility among stroke survivors by accelerometry. Top Stroke Rehabil 14: 9–21. - PubMed
Publication types
MeSH terms
LinkOut - more resources
Full Text Sources
Other Literature Sources
Medical
