. 2014 Jul;10(7):1241-55.
doi: 10.4161/auto.28912. Epub 2014 May 15.

Itraconazole suppresses the growth of glioblastoma through induction of autophagy: involvement of abnormal cholesterol trafficking

Affiliations

Itraconazole suppresses the growth of glioblastoma through induction of autophagy: involvement of abnormal cholesterol trafficking

Rui Liu et al. Autophagy. 2014 Jul.

Abstract

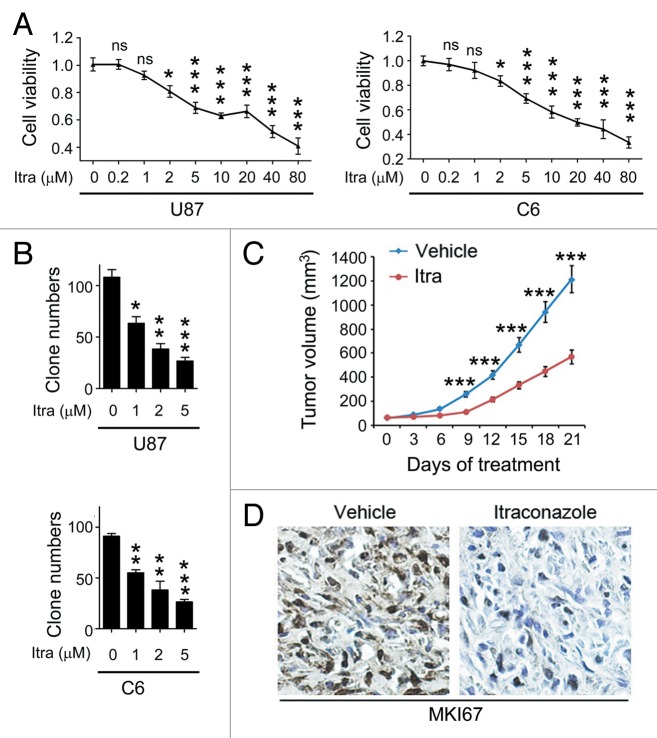
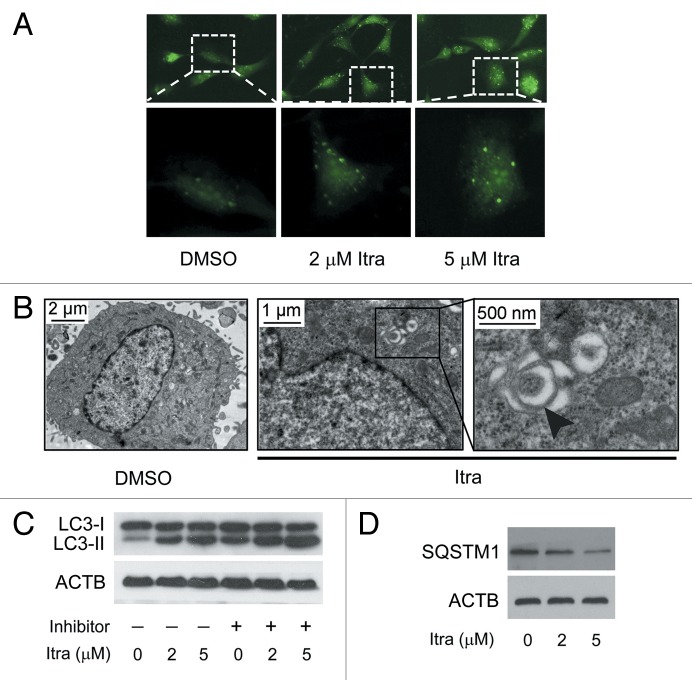
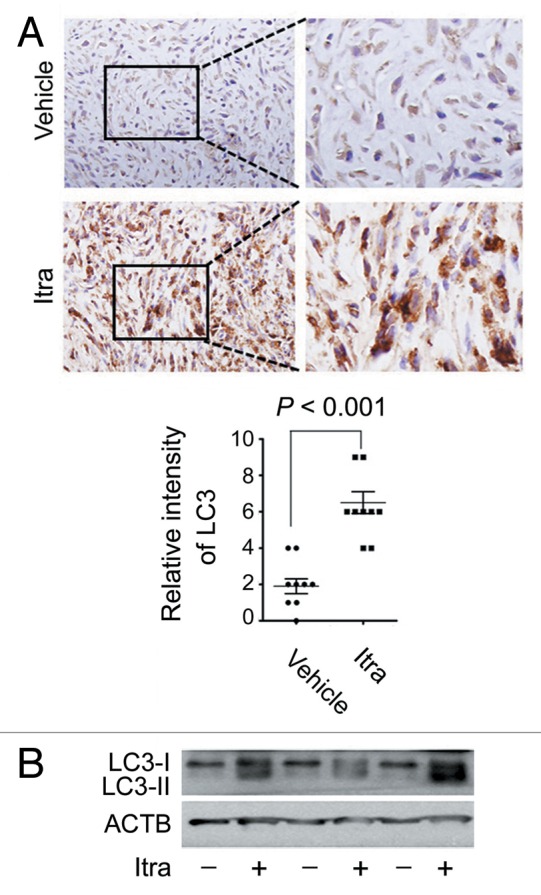
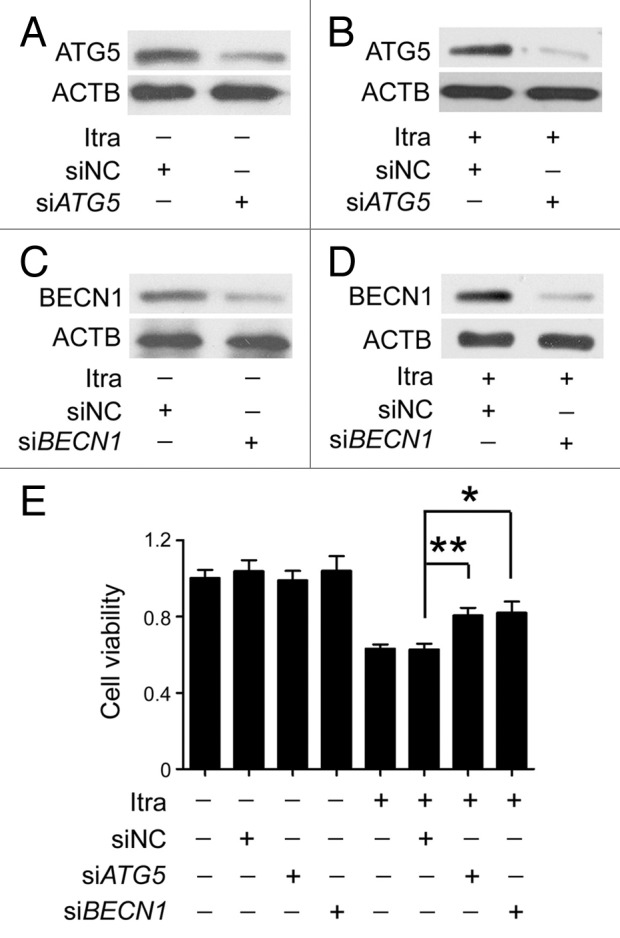
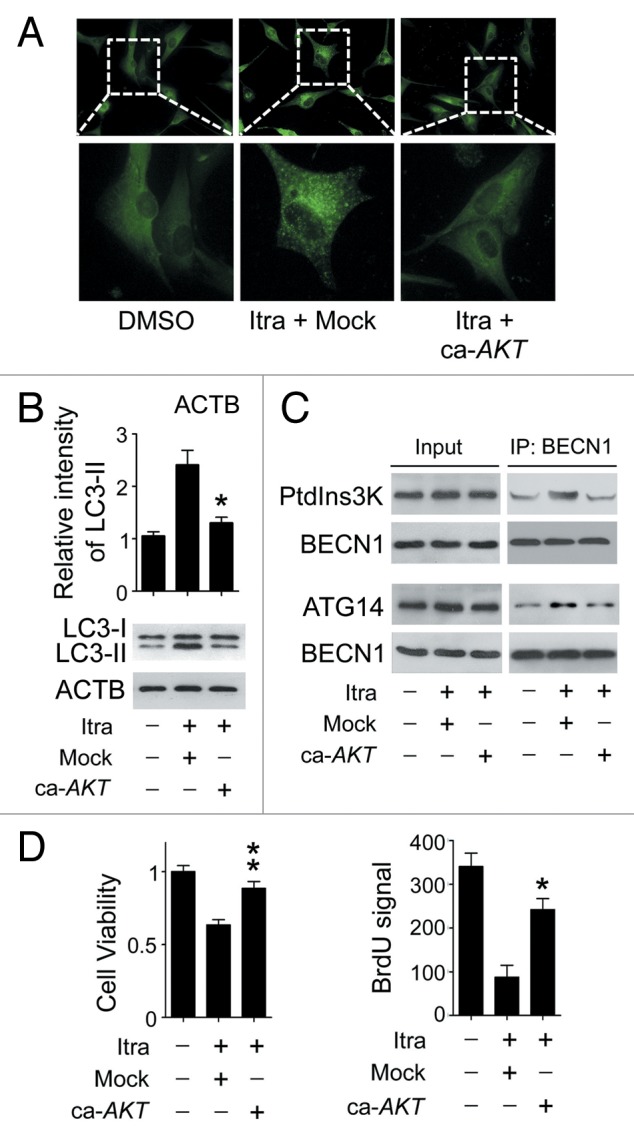
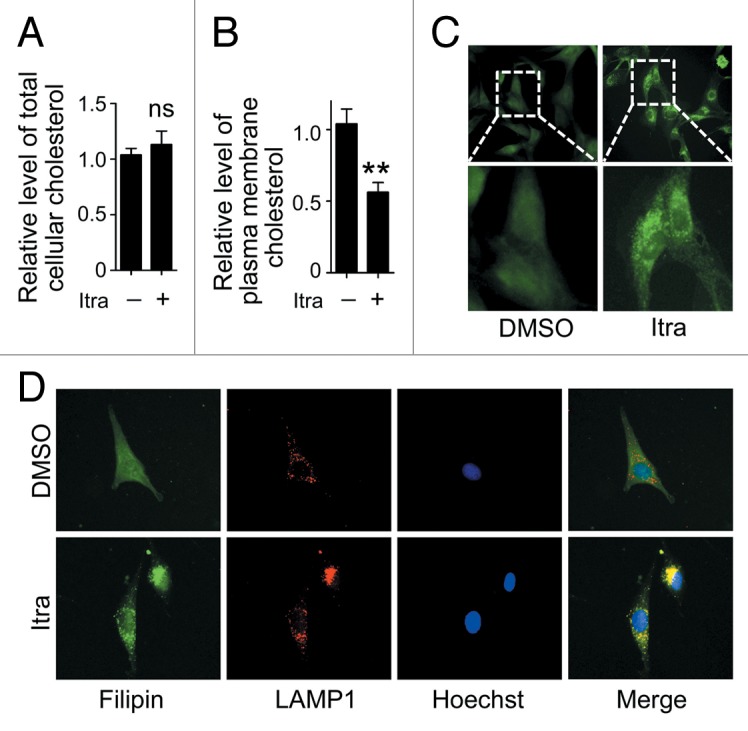
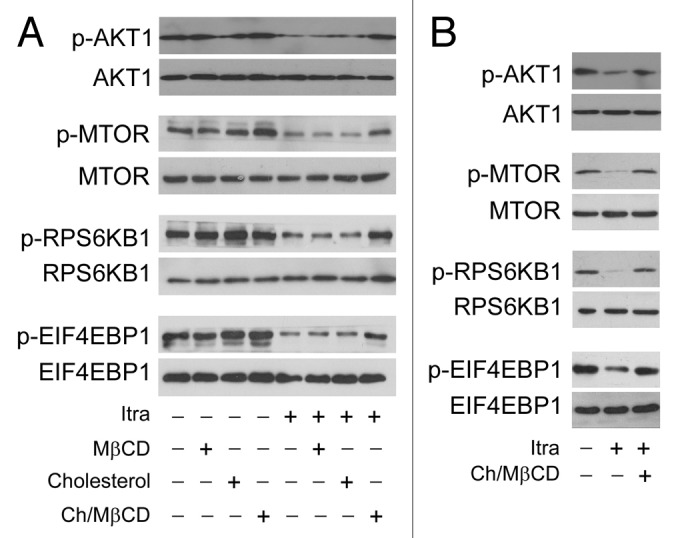
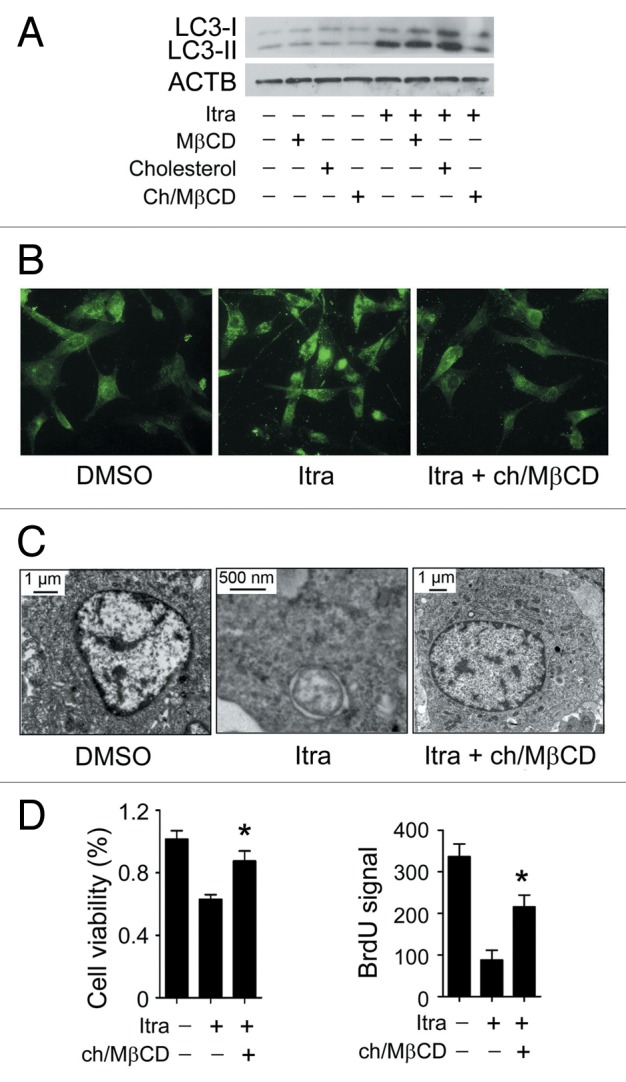
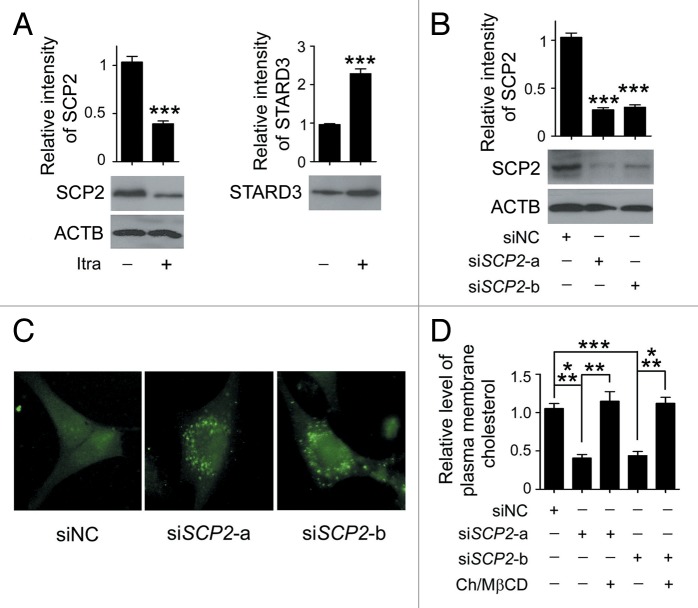
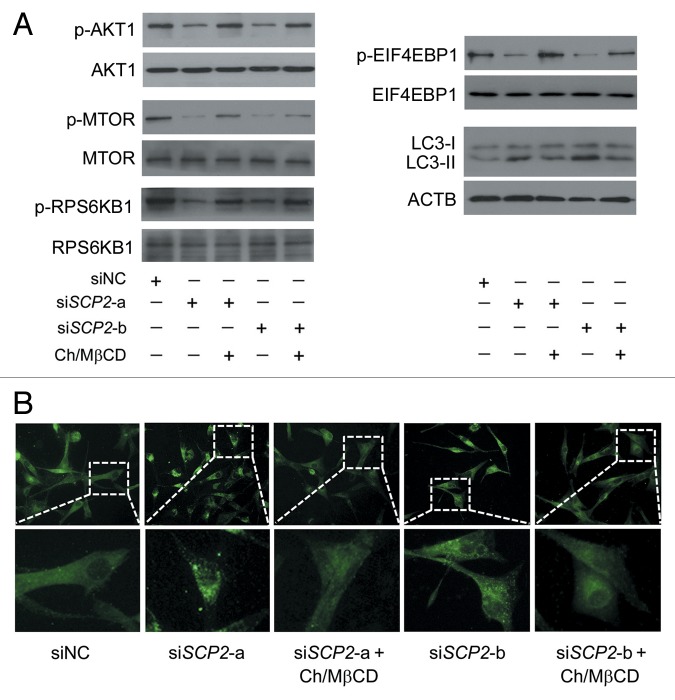
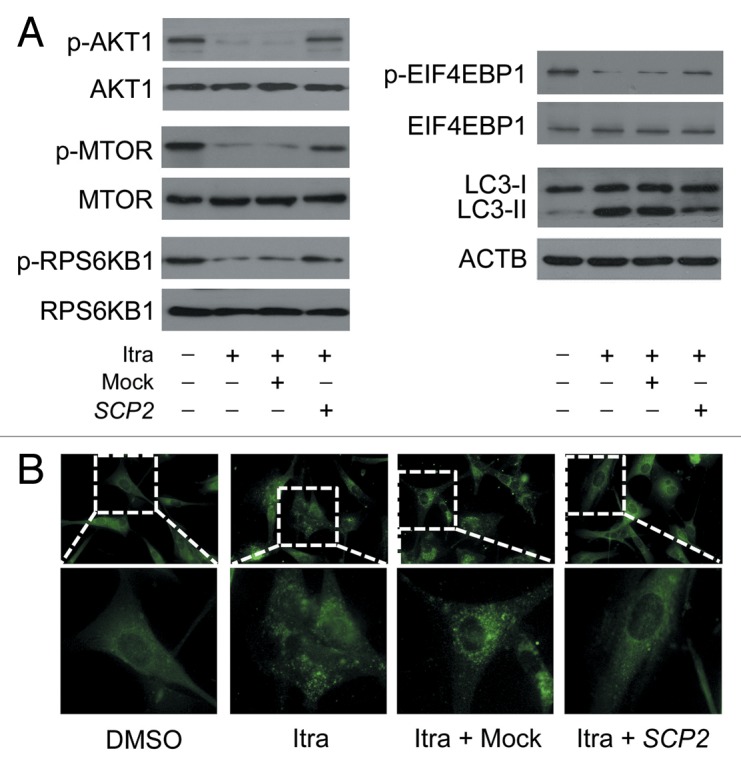
Glioblastoma is one of the most aggressive human cancers with poor prognosis, and therefore a critical need exists for novel therapeutic strategies for management of glioblastoma patients. Itraconazole, a traditional antifungal drug, has been identified as a novel potential anticancer agent due to its inhibitory effects on cell proliferation and tumor angiogenesis; however, the molecular mechanisms involved are still unclear. Here, we show that itraconazole inhibits the proliferation of glioblastoma cells both in vitro and in vivo. Notably, we demonstrate that treatment with itraconazole induces autophagic progression in glioblastoma cells, while blockage of autophagy markedly reverses the antiproliferative activities of itraconazole, suggesting an antitumor effect of autophagy in response to itraconazole treatment. Functional studies revealed that itraconazole retarded the trafficking of cholesterol from late endosomes and lysosomes to the plasma membrane by reducing the levels of SCP2, resulting in repression of AKT1-MTOR signaling, induction of autophagy, and finally inhibition of cell proliferation. Together, our studies provide new insights into the molecular mechanisms regarding the antitumor activities of itraconazole, and may further assist both the pharmacological investigation and rational use of itraconazole in potential clinical applications.

Keywords: BECN1-PtdIns3K complex; antiproliferative; autophagy; cholesterol trafficking; itraconazole.


Figures

None
Figure 1. Itraconazole inhibits glioblastoma tumor growth. (A) U87 or C6 cells were treated with indicated concentrations of itraconazole for 36 h. Cell viability was measured by the MTT assay. The data were representative of 5 independent experiments. (B) U87 or C6 cells were consecutively treated with indicated concentrations of itraconazole for 2 wk. Cell proliferation was examined by colony formation assay. The data were representative of 3 independent experiments. (C) Nude mice with U87 subcutaneous tumor xenografts were treated with hydroxypropyl-cyclodextrin (vehicle, n = 9) or 75 mg/kg itraconazole (n = 9) twice daily by oral gavage for 3 wk. During drug treatment, tumor volumes were monitored every 3 d. (D) MKI67 expression in tumors from vehicle- or itraconazole-treated mice was examined by immunohistochemistry. Representative images of MKI67 immunohistochemistry were shown. *P < 0.05; **P < 0.01; ***P < 0.001; Itra, itraconazole.
None
Figure 2. Itraconazole induces autophagy in glioblastoma cells. (A) U87 cells were transfected with a pEGFP-LC3 plasmid. After 36 h, cells were treated with DMSO or indicated concentrations of itraconazole for another 36 h. Formation of EGFP-LC3 puncta was visualized by fluorescence microscopy. The data are representative of 3 independent experiments. (B) U87 cells were treated with DMSO or 5 μM itraconazole for 36 h, and formation of autophagic vacuoles was examined by TEM analysis. The data are representative of 3 independent experiments. (C) U87 cells were treated with DMSO or indicated concentrations of itraconazole for 36 h. Lysosomal protease inhibitors (E64d and pepstatin A each at 10 µg/ml) were applied for 3 h at the end of treatment time of itraconazole. Conversion of LC3-I to LC3-II was examined by immunoblot. The data are representative of 3 independent experiments. (D) U87 cells were treated with DMSO or indicated concentrations of itraconazole for 36 h, and expression of SQSTM1 was determined by immunoblot. The data are representative of 3 independent experiments. Itra, itraconazole.
None
Figure 3. Itraconazole induces autophagy in vivo. (A) Nude mice with U87 subcutaneous tumor xenografts were treated with hydroxypropyl-cyclodextrin (vehicle, n = 9) or 75 mg/kg itraconazole (n = 9) twice daily by oral gavage for 3 wk. LC3 expression in tumor xenografts was examined by immunohistochemistry. Eight individual fields of each slide were randomly selected for evaluation of the intensity of LC3 staining. (B) Conversion of LC3-I to LC3-II in tumors from vehicle- or itraconazole-treated mice was examined by immunoblot. Representative image of LC3 immunoblots was shown. Itra, itraconazole.
None
Figure 4. Inhibition of autophagy represses the antiproliferative effect of itraconazole. (A) U87 cells were transfected with siNC (negative control) or siATG5 for 72 h, and expression of ATG5 was examined by immunoblot. The data are representative of 3 independent experiments. (B) U87 cells were transfected with siNC or siATG5 for 36 h, and then treated with 5 μM itraconazole for another 36 h. Expression of ATG5 was examined by immunoblot. The data are representative of 3 independent experiments. (C) U87 cells were transfected with siNC or siBECN1 for 72 h, and expression of BECN1 was examined by immunoblot. The data are representative of 3 independent experiments. (D) U87 cells were transfected with siNC or siBECN1 for 36 h, and then treated with DMSO or 5 μM itraconazole for another 36 h. Expression of BECN1 was examined by immunoblot. The data are representative of 3 independent experiments. (E) U87 cells were transfected with siNC, siATG5, or siBECN1 for 36 h, and then treated with 5 μM itraconazole for another 36 h. Cell proliferation was examined by the MTT assay. The data are representative of 5 independent experiments for the MTT assay. *P < 0.05; **P < 0.01; Itra, itraconazole.
None
Figure 5. Itraconazole inhibits the AKT1-MTOR pathway. (A) U87 or C6 cells were treated with DMSO, indicated concentrations of itraconazole or 100 nM rapamycin for 36 h. Phosphorylation of MTOR (Ser2448), RPS6KB1 (Ser424 and Thr421), and EIF4EBP1 (Ser65 and Thr70) was examined by immunoblot. Total MTOR, RPS6KB, or EIF4EBP1 respectively was used as the internal control. The data are representative of 3 independent experiments. (B) U87 or C6 cells were treated with DMSO or the indicated concentrations of itraconazole. Phosphorylation of AKT1 (Ser473), CDKN1A (Thr145), and CDKN1B (Thr198) was examined by immunoblot. Total AKT1, CDKN1A, and CDKN1B, respectively was used as the internal control. The data are representative of 3 independent experiments. *P < 0.05; **P < 0.01; ***P < 0.001; Itra, itraconazole; Rapa, rapamycin.
None
Figure 6. Itraconazole induces autophagy by repressing the AKT1-MTOR pathway. (A) U87 cells were transfected with mock vector or ca-AKT1. Thirty-six hours after transfection, the cells were treated with DMSO or 5 μM itraconazole for another 36 h. Formation of endogenous LC3 puncta were examined by immunofluorescence staining using a fluorescence microscope. The data are representative of 3 independent experiments. (B and C) U87 cells were transfected with mock vector or ca-AKT1. Thirty-six hours after transfection, the cells were treated with DMSO or 5 μM itraconazole for another 36 h. Conversion of LC3-I to LC3-II was examined by immunoblot (B). Interaction between BECN1 and PtdIns3K, or BECN1 and ATG14 was determined by coimmunoprecipitation (C). The data are representative of 3 independent experiments. (D) U87 cells were transfected with mock vector or ca-AKT1. Thirty-six hours after transfection, the cells were treated with DMSO or 5 μM itraconazole for another 36 h. Cell proliferation was examined by the MTT assay (left panel) and the BrdU incorporation assay (right panel). The data are representative of 3 independent experiments for both the MTT assay and BrdU incorporation assays. *P < 0.05; **P < 0.01; Itra, itraconazole.
None
Figure 7. Itraconazole decreases cholesterol content in the plasma membrane. U87 cells were treated with DMSO or 5 μM itraconazole for 36 h. (A) The level of total cellular cholesterol was examined using the Cholesterol Assay Kit. The data are representative of 3 independent experiments. (B) Plasma membrane fraction was isolated by sucrose density gradient centrifugation, and the level of cholesterol on plasma membrane was examined using the Cholesterol Assay Kit. The data are representative of 4 independent experiments. (C) Cytoplasmic cholesterol distribution was examined by filipin staining. The data are representative of 3 independent experiments. (D) Cellular cholesterol distribution was determined by filipin staining coupled with LAMP1 immunofluorescence staining. The data are representative of 3 independent experiments. **P < 0.01; ns, not significant; Itra, itraconazole.
None
Figure 8. Itraconazole-induced cholesterol redistribution inhibits the AKT1-MTOR pathway. (A) U87 cells were treated with itraconazole (5 μM) in the presence of MβCD (1 mg/ml), cholesterol (20 μg/ml) or the MβCD-cholesterol complex (containing 1 mg/ml MβCD and 20 μg/ml cholesterol) for 36 h. Phosphorylation of AKT1 (Ser473), MTOR (Ser2448), RPS6KB1 (Ser424 and Thr421), and EIF4EBP1 (Ser65 and Thr70) was examined by immunoblot. Total AKT1, MTOR, RPS6KB, or EIF4EBP1 was used as internal control for p-AKT1, p-MTOR, p-RPS6KB, or p-EIF4EBP1, respectively. The data are representative of 3 independent experiments. (B) U87 cells were treated with itraconazole (5 μM) for 36 h, washed with PBS, and then incubated with the MβCD-cholesterol complex (containing 2 mg/ml MβCD and 80 μg/ml cholesterol) for 4 h. Phosphorylation of AKT1 (Ser473), MTOR (Ser2448), RPS6KB1 (Ser424 and Thr421), and EIF4EBP1 (Ser65 and Thr70) was examined by immunoblot. Total AKT1, MTOR, RPS6KB, or EIF4EBP1 was respectively used as internal control. The data are representative of 3 independent experiments. Ch/MβCD, MβCD-cholesterol complex; Itra, itraconazole.
None
Figure 9. Itraconazole-induced cholesterol redistribution induces autophagy. (A) U87 cells were treated with itraconazole (5 μM) in the presence of MβCD (1 mg/ml), cholesterol (20 μg/ml) or the MβCD-cholesterol complex (containing 1 mg/ml MβCD and 20 μg/ml cholesterol) for 36 h. Conversion of LC3-I to LC3-II was examined by immunoblot. ACTB was used as the internal control for LC3. The data are representative of 3 independent experiments. (B) U87 cells were treated with itraconazole (5 μM) in the presence or absence of the MβCD-cholesterol complex (containing 1 mg/ml MβCD and 20 μg/ml cholesterol) for 36 h. Formation of endogenous LC3 puncta was examined via immunofluorescence staining using a fluorescence microscope. The data are representative of 3 independent experiments. (C) U87 cells were treated with DMSO or 5 μM itraconazole for 36 h in the presence or absence of the MβCD-cholesterol complex (containing 1 mg/ml MβCD and 20 μg/ml cholesterol). The formation of autophagic vacuoles was examined by TEM. The data are representative of 3 independent experiments. (D) U87 cells were treated with itraconazole (5 μM) in the presence or absence of the MβCD-cholesterol complex (containing 1 mg/ml MβCD and 20 μg/ml cholesterol) for 36 h. Cell proliferation was determined by the MTT assay (left panel) or the BrdU incorporation assay (right panel). The data are representative of 4 independent experiments for the MTT assay, and 3 independent experiments for the BrdU incorporation assay. *P < 0.05; Ch/MβCD, MβCD-cholesterol complex; Itra, itraconazole.
None
Figure 10. Reduced SCP2 expression induces deprivation of cholesterol in the plasma membrane. (A) U87 cells were treated with DMSO or 5 μM itraconazole for 36 h and the expression of SCP2 and STARD3 was examined by immunoblot. The data are representative of 3 independent experiments. (B) U87 cells were transfected with siNC, siSCP2-a, or siSCP2-b. Expression of SCP2 was examined by immunoblot 72 h after transfection. The data are representative of 3 independent experiments. (C) U87 cells were transfected with siNC, siSCP2-a, or siSCP2-b for 72 h. Cholesterol distribution was examined by filipin staining. The data are representative of 3 independent experiments. (D) U87 cells were transfected with siNC, siSCP2-a, or siSCP2-b. Thirty-six hours after transfection, the cells were incubated with fresh medium or medium containing the MβCD-cholesterol complex (containing 1 mg/ml MβCD and 20 μg/ml cholesterol) for another 36 h. The plasma membrane fraction was isolated by sucrose density gradient centrifugation, and the level of cholesterol in the plasma membrane was examined using the Cholesterol Assay Kit. The data are representative of 3 independent experiments. **P < 0.01; ***P < 0.001; ns, not significant; Ch/MβCD, MβCD-cholesterol complex.
None
Figure 11. Reduced SCP2 expression inhibits the AKT1-MTOR pathway and induces autophagy. (A) U87 cells were transfected with siNC, siSCP2-a, or siSCP2-b. Thirty-six hours after transfection, the cells were incubated with fresh medium or medium containing the MβCD-cholesterol complex (containing 1 mg/ml MβCD and 20 μg/ml cholesterol) for another 36 h. Phosphorylation of AKT1 (Ser473), MTOR (Ser2448), RPS6KB1 (Ser424 and Thr421), and EIF4EBP1 (Ser65 and Thr70) and conversion of LC3-I to LC3-II were examined by immunoblot. Total AKT1, MTOR, RPS6KB, or EIF4EBP1 was used as internal control for p-AKT1, p-MTOR, p-RPS6KB or p-EIF4EBP1, respectively. ACTB was used as the internal control for LC3. The data are representative of 3 independent experiments. (B) U87 cells were transfected with siNC, siSCP2-a, or siSCP2-b. Thirty-six hours after transfection, the cells were incubated with fresh medium or medium containing the MβCD-cholesterol complex (containing 1 mg/ml MβCD and 20 μg/ml cholesterol) for another 36 h. Formation of endogenous LC3 puncta was examined via immunofluorescence staining using a fluorescence microscope. The data are representative of 3 independent experiments. Ch/MβCD, MβCD-cholesterol complex.
None
Figure 12. Overexpression of SCP2 attenuates itraconazole-mediated MTOR inhibition and autophagy activation. U87 cells were transfected with mock vector or SCP2 expression plasmid. After 36 h, cells were treated with DMSO or 5 μM itraconazole for another 36 h. (A) Phosphorylation of AKT1 (Ser473), MTOR (Ser2448), RPS6KB1 (Ser424 and Thr421), and EIF4EBP1 (Ser65 and Thr70) and conversion of LC3-I to LC3-II were examined by immunoblot. Total AKT1, MTOR, RPS6KB1, or EIF4EBP1 was used as internal control for p-AKT1, p-MTOR, p-RPS6KB1, or p-EIF4EBP1, respectively. ACTB was used as the internal control for LC3. The data are representative of 3 independent experiments. (B) Formation of endogenous LC3 puncta was examined via immunofluorescence staining using a fluorescence microscope. The data are representative of 3 independent experiments. Itra, itraconazole.

Similar articles

Cited by

References

    1. Huse JT, Holland E, DeAngelis LM. Glioblastoma: molecular analysis and clinical implications. Annu Rev Med. 2013;64:59–70. doi: 10.1146/annurev-med-100711-143028. - DOI - PubMed
    1. Lima FR, Kahn SA, Soletti RC, Biasoli D, Alves T, da Fonseca AC, Garcia C, Romão L, Brito J, Holanda-Afonso R, et al. Glioblastoma: therapeutic challenges, what lies ahead. Biochim Biophys Acta. 2012;1826:338–49. - PubMed
    1. Reardon DA, Wen PY. Therapeutic advances in the treatment of glioblastoma: rationale and potential role of targeted agents. Oncologist. 2006;11:152–64. doi: 10.1634/theoncologist.11-2-152. - DOI - PubMed
    1. Ohgaki H, Kleihues P. Genetic pathways to primary and secondary glioblastoma. Am J Pathol. 2007;170:1445–53. doi: 10.2353/ajpath.2007.070011. - DOI - PMC - PubMed
    1. Wen PY, Kesari S. Malignant gliomas in adults. N Engl J Med. 2008;359:492–507. doi: 10.1056/NEJMra0708126. - DOI - PubMed

Publication types

MeSH terms