. 2014 Jun 6;9(6):e98641.
doi: 10.1371/journal.pone.0098641. eCollection 2014.

Insulin-like-growth-factor-binding-protein-3 (IGFBP-3) contrasts melanoma progression in vitro and in vivo

Affiliations

Insulin-like-growth-factor-binding-protein-3 (IGFBP-3) contrasts melanoma progression in vitro and in vivo

Antimo Naspi et al. PLoS One. .

Abstract

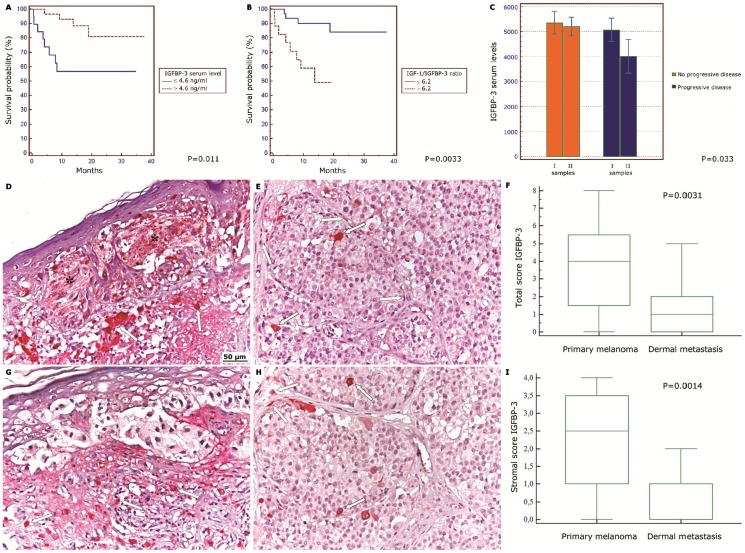
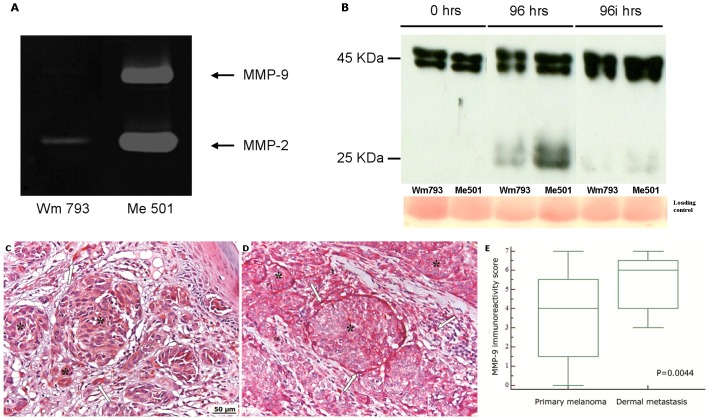
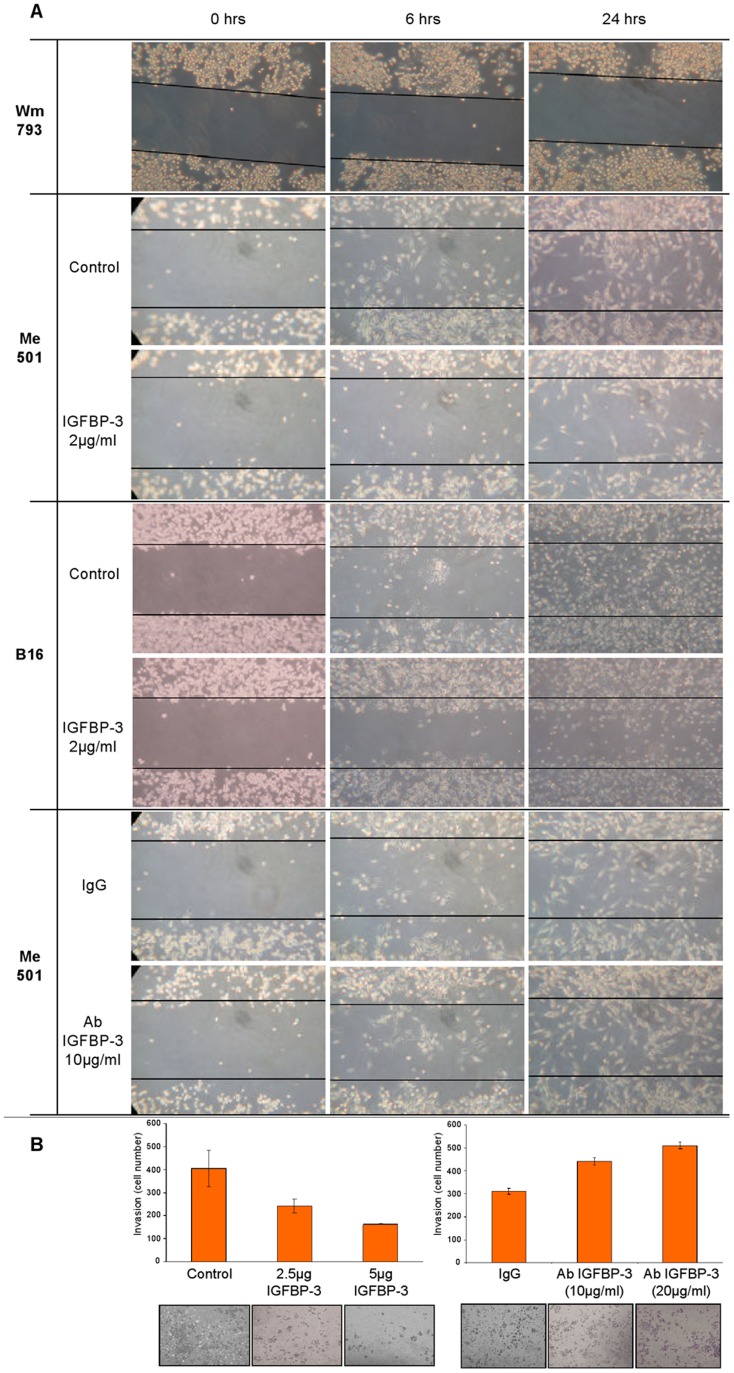
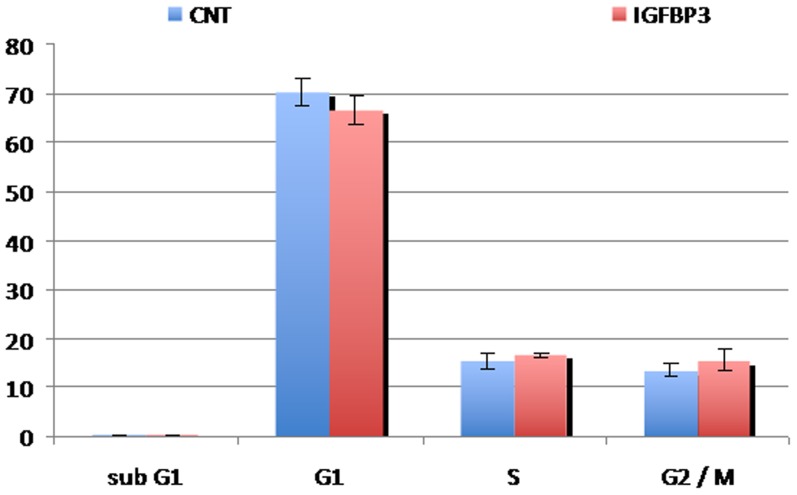
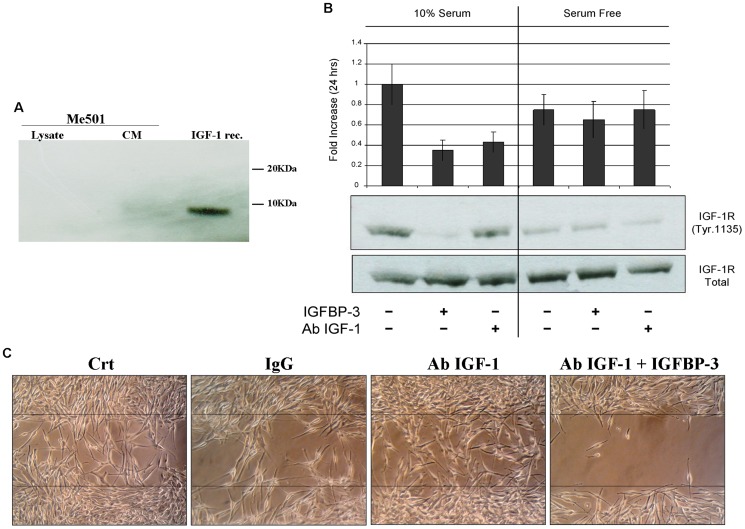
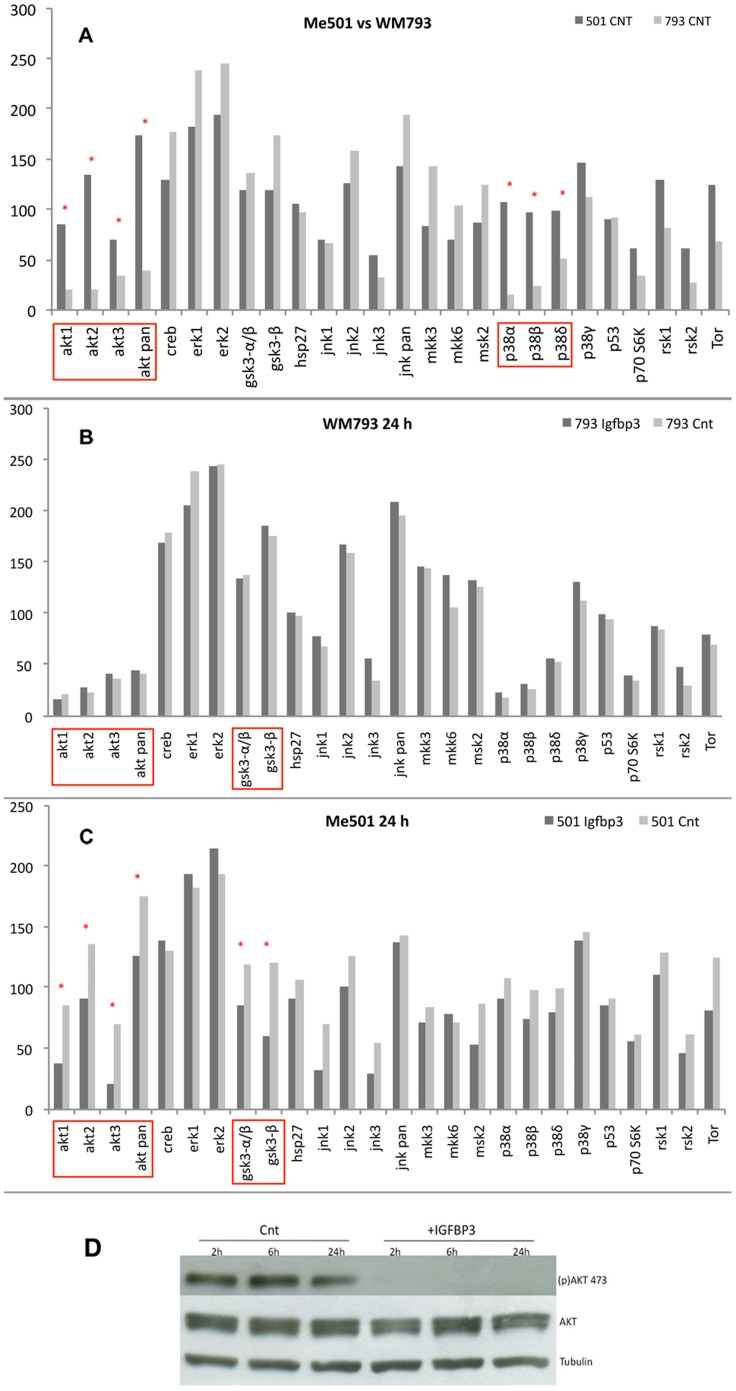
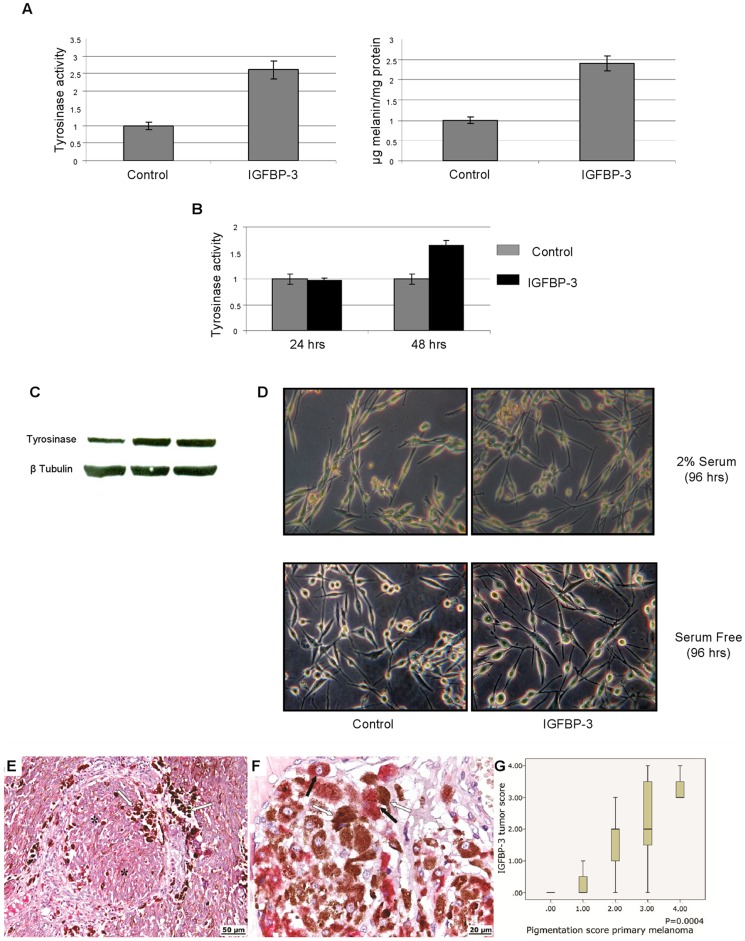
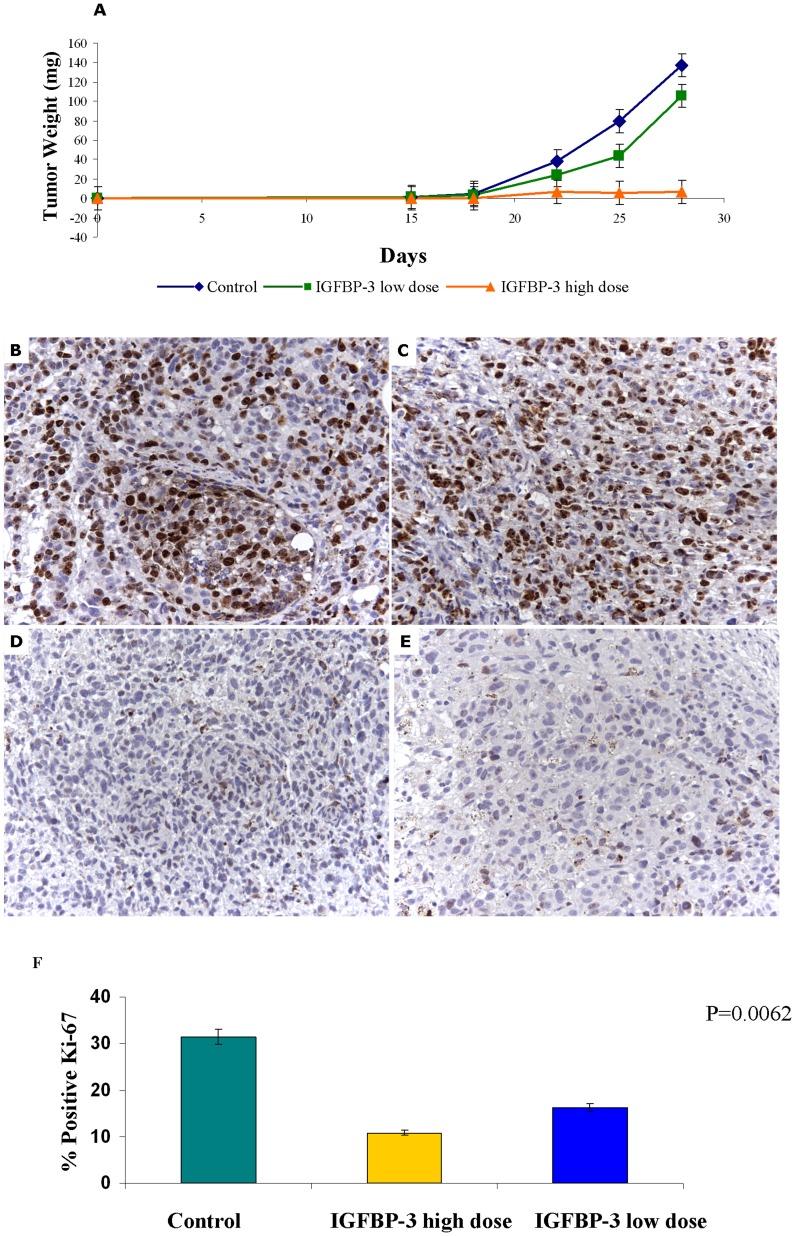
Insulin-like-factor-binding-protein 3 (IGFBP-3) is known to modulate the activity of insulin-like growth factors (IGFs) besides having a number of IGF-independent effects on cell growth and survival. IGFBP-3 has been reported to decrease significantly in the blood serum of patients affected by certain cancers. In the present work, we have evaluated the levels of IGFBP-3 in the blood serum and tissues of patients affected by cutaneous melanoma, showing that loss of IGFBP-3 from both is strongly correlated with disease progression and reduced survival. In vitro treatment with IGFBP-3 of human and murine metastatic melanoma cell lines specifically inhibited the cells' migratory and invasive behaviour, inducing up-regulation of melanocytic differentiation markers such as tyrosinase activity and melanin content. A molecular analysis of the cellular pathways transducing the effect of IGFBP-3 implicated the Akt-GSK3β axis. Moreover, administration of IGFBP-3 in vivo to SCID mice inoculated with human metastatic melanoma cells strongly reduced or completely inhibited tumor growth. In summary, IGFBP-3 appears to exert a specific inhibitory effect on melanoma growth and dissemination, suggesting that it may qualify as a useful therapeutic agent in melanomas and perhaps other cancers, at the least as a valid adjuvant therapy during treatment with conventional anti-tumoral drugs.


Conflict of interest statement

Competing Interests: The authors have declared that no competing interests exist.

Figures

Figure 1
Figure 1. Low IGFBP-3 levels correlate with melanoma progression and patients' survival.
(A) Kaplan-Meier survival curve of melanoma patients having seric IGFPB-3 concentration higher (red line) or lower (blue line) than 4.6 ng/mL. Cut-off value was chosen by ROC curve. P value was calculated by log rank test. (B) Kaplan-Meier survival curve of patients with IGF-1/IGFBP-3 ratio higher (red line) or lower (blue line) than 6.2. Cut-off value was chosen by ROC curve. P value was calculated by log rank test. (C) Mean IGFBP-3 serum levels measured twice (28 patients) during the follow-up. Orange boxes: Patients with stable disease. Blue boxes: patients with progressive disease. P value was calculated by ANOVA test. (D,G) IGFBP-3 immuno-staining in tissue samples from primary melanomas. (E, H) IGFBP-3 immuno-staining in tissue samples from metastatic melanomas. The asterisks indicate positive melanocytes nests in primary melanoma. The arrows indicate IGFBP-3 positive stromal cells. Original magnification, X100. (F,I) Graphic data processing for total (upper panel) and stromal (lower panel) IGFBP-3 immuno-staining score. 20 different samples were taken in each case and the number of IGFBP-3 positive cells was separately counted by two researchers. For each slide, at least 7–10 microscopic fields were randomly chosen. The immuno-histochemical score was evaluated as described in the Methods separately for melanocytic and stromal cells and expressed as tumour and stromal score respectively. A total score was derived for each sample as the sum of tumour and stromal score. Central boxes correspond to values from lower to upper quartile (25th–75th percentile). Middle lines show median. Vertical lines extend from minimum to maximum value. P value calculated by Mann-Whitney U test.
Figure 2
Figure 2. Different expression of MMP-9 in primary and metastatic melanoma.
(A) Detection of MMP-2 and MMP-9 activity in the culture media of WM793 and Me501 cells by zymographic assay. The arrows point to the areas of degradation of the gelatine matrix produced by the indicated proteases (B) Western blot analysis showing degradation over time of IGFBP-3 by melanoma-produced proteases. Human recombinant IGFBP-3 was incubated for the indicated times with the culture media of the primary melanoma line WM793 or of the metastatic line Me501, in the absence (96 hrs) or in the presence (96i hrs) of protease inhibitors. A Red Ponceau staining of the original gel is shown on the bottom as the loading control. (C,D) MMP-9 immunostaining of primary (C) and metastatic (D) melanoma. Asterisks indicate melanocytes nests and the arrows indicate stromal cells. Original magnification, X100. (E) Comparison of the MMP-9 reactivity score of primary and metastatic melanoma. Central boxes represent values from lower to upper quartile (25th–75th percentile). Middle lines represent median. Vertical lines extend from minimum to maximum value. P value was calculated by Mann-Whitney U test. The reactive cells were counted, and the scores determined, as described in Fig. 1 and in the Methods section.
Figure 3
Figure 3. Inverse correlation between immuno-histochemical expression of IGFBP-3 and MMP-9.
Comparison of the immunohistochemistry for IGFBP-3 (A, C, E) and MMP-9 (B, D, F) in sequential sections obtained from primary melanomas and dermal metastases. The asterisks mark the melanocytes nests while the arrows indicate the stromal tissue. Original magnification X100. The IGFBP-3 and MMP-9 reactive cells were counted, and the scores determined, as described in Fig. 1 and in the Methods section.
Figure 4
Figure 4. IGFBP-3 reduces motile and invasive behavior of melanoma cells.
(A) First row: a representative migration pattern of human primary melanoma cells (WM793), either IGFBP-3-treated or untreated. Second and third row: migration pattern of human metastatic melanoma cells (Me501) untreated or treated with 2 µg/mL IGFBP-3. Fourth and fifth row: murine metastatic melanoma cells (B16), untreated or treated with 2 µg/mL IGFBP-3. Last two rows: Me501 cells treated with unspecific IgG or with 10 µg/mL of anti-IGFBP-3 antibody. Scratch-test assays were performed as described in the Methods and the images were captured at 0, 6, 24 h after incubation. All the experiments shown were repeated three or more times. (B) Left panel: invasiveness pattern of Me501 cells, untreated or treated for 48 h with the indicated doses of IGFBP-3. Right panel: invasiveness pattern of Me501 cells untreated or treated for 48 h with the indicated doses of anti-IGFBP-3 antibodies. Trans-well migration/invasion assays were performed as described in the Methods. Invasiveness assays were repeated three or more times.
Figure 5
Figure 5. IGFBP-3 does not alter cell proliferation.
Cell-cycle distribution evaluated by FACS analysis of Me501cells untreated or treated with IGFBP-3. The areas of the peaks corresponding to each phase were evaluated and plotted as an histogram. The experiment was performed in triplicate.
Figure 6
Figure 6. IGFBP-3 acts independently of IGF-1.
A) Western blot analysis for the detection of IGF-1 in lysates or culture media (CM) of Me501 cells. IGF-1 rec represents the positive control with recombinant IGF-1 (5 ng). B) Western blot analysis for detection of Tyr 1135-phosphorylation on the IGF-1 receptor β. Me501 cells were grown for 24 h in the presence of 10% serum (left panels) or in the absence of serum (right panels). For each group, treatments with IGFBP-3 or with anti-IGF-1 antibodies were performed. The amount of phosphorylated IGF-1-β receptor was quantified by densitometric analysis using total receptor (which remained unchanged) as the internal standard. C) Scratch-repair capacity of Me501 cells in the presence of anti-IGF1-antibodies and of IGFBP-3. The images shown are representative of experiments that were repeated at least three times.
Figure 7
Figure 7. Analysis by phosphor-proteomic arrays of signal-transduction pathways involving in mediating IGFBP-3 action.
(A) Phosphorylation state of the indicated markers in primary (WM 793, light grey) and metastatic (Me501, dark grey) human melanoma cells, untreated. (B) WM 793 cells before (light grey) and after (dark grey) treatment with IGFBP-3 (C) Me501 cells before (light grey) and after (dark grey) treatment with IGFBP-3. The assays were performed and quantified as described in the Methods. All determinations were repeated at least three times (D) Western blot analysis of the phosphorylation state of Akt (Ser 473) in Me501 cells untreated or treated with IGFBP-3 for the indicated times. pAKT 473 =  phosphor-(Ser473); AKT =  total AKT: Tub =  tubulin. The gel shown is representative of experiments that were repeated at least three times.
Figure 8
Figure 8. IGFBP-3 up-regulates tyrosinase activity and increases melanin content in Me501 cells.
(A) Tyrosinase activity measured by L-DOPA oxidation (left panel) and melanin content determined by measuring the absorbance at 405 nm (right panel) of lysates of Me501 cells grown in 2% serum, untreated or treated for 96 h with IGFBP-3 (2 µg/mL). (B) Tyrosinase activity of lysates of Me501 cell grown in the absence of serum for 24 and 48 h, treated and untreated with IGFBP-3 (C) Western blot analysis of tyrosinase content in Me501 cells after 0, 24 and 48 h of treatment with IGFBP-3 (2 µg/mL). (D) Phase-contrast microscopy of untreated and IGFBP-3-treated (2 µg/mL) Me501 cells, grown in the presence and in the absence of serum. Original magnification X100. (E, F) IGFBP-3 immuno-histochemical positivity in primary melanoma correlates positively with melanin content. IGFBP-3 is stained red, while melanin stains as dark-brown spots (E) X200 magnification (F) X400 magnification. The asterisks mark the IGFBP-3 immuno-positive melanocyte nests, the white and black arrows indicate the clusters of melanin and IGFBP–3 positive melanocytes, respectively. (G) Box plots showing the correlation between IGFBP-3 tumor score (calculated as described in the Methods) and sample pigmentation. P value was calculated by Mann-Whitney U test.
Figure 9
Figure 9. IGFBP-3 inhibits tumour growth in vivo.
(A) Effect of treatment with low (0.37 mg/Kg, green curve) and high (1.87 mg/kg, orange curve) IGFBP-3 doses on the growth over time of Me501 xenografts in SCID mice. Mean results are representative of two different experiments (each experiment on at least 8 mice). Tumor size was measured three times per week with calipers, and volume was calculated as described in the “Methods” section. (B) Immuno-histochemical staining of the cell proliferation marker Ki-67 in Me501 xenografts in tumours excised from SCID mice untreated (A–B) or treated with 1.87 mg/kg IGFBP-3 (C–D). (F) Graph reporting the mean values of Ki-67 positive cells in melanomas from control mice and mice treated with low and high doses of IGFBP-3. The proliferation index was determined as the percentage of proliferating cells (Ki-67 positive cells) in a population of about 800 cells. For this purpose two representative fields were randomly selected in each section and blind-counted by two independent observers. P value was calculated by Mann-Whitney U test.

Similar articles

Cited by

References

    1. Manola J, Atkins M, Ibrahim J, Kirkwood J (2000) Prognostic factors in metastatic melanoma: a pooled analysis of Eastern Cooperative Oncology Group trials. J Clin Oncol. Nov 15 18(22): 3782–93. - PubMed
    1. Ries LA, Wingo PA, Miller DS, Howe HL, Weir HK, et al. (2000) The annual report to the nation on the status of cancer, 1973–1997, with a special section on colorectal cancer. Cancer 88: 2398–2424. - PubMed
    1. Lomas J, Martin-Duque P, Pons M, Quintanilla M (2008) The genetics of malignant melanoma. Front Biosci 13: 5071–5093. - PubMed
    1. Balch CM, Gershenwald JE, Soong SJ, Thompson JF, Atkins MB, et al. (2009) Final version of 2009 AJCC melanoma staging and classification. J Clin Oncol 27(36): 6199–206. - PMC - PubMed
    1. Hwa V, Oh Y, Rosenfeld RG (1999) The insulin-like growth factor-binding protein (IGFBP) superfamily. Endocr Rev. 20(6): 761–87. - PubMed

Publication types

MeSH terms

Substances