

Epidemic process over the commute network in a metropolitan area
- PMID: 24905831
- PMCID: PMC4048205
- DOI: 10.1371/journal.pone.0098518
Epidemic process over the commute network in a metropolitan area
Erratum in
-
Correction: Epidemic process over the commute network in a metropolitan area.PLoS One. 2015 Jul 8;10(7):e0132238. doi: 10.1371/journal.pone.0132238. eCollection 2015. PLoS One. 2015. PMID: 26153690 Free PMC article. No abstract available.
Abstract
An understanding of epidemiological dynamics is important for prevention and control of epidemic outbreaks. However, previous studies tend to focus only on specific areas, indicating that application to another area or intervention strategy requires a similar time-consuming simulation. Here, we study the epidemic dynamics of the disease-spread over a commute network, using the Tokyo metropolitan area as an example, in an attempt to elucidate the general properties of epidemic spread over a commute network that could be used for a prediction in any metropolitan area. The model is formulated on the basis of a metapopulation network in which local populations are interconnected by actual commuter flows in the Tokyo metropolitan area and the spread of infection is simulated by an individual-based model. We find that the probability of a global epidemic as well as the final epidemic sizes in both global and local populations, the timing of the epidemic peak, and the time at which the epidemic reaches a local population are mainly determined by the joint distribution of the local population sizes connected by the commuter flows, but are insensitive to geographical or topological structure of the network. Moreover, there is a strong relation between the population size and the time that the epidemic reaches this local population and we are able to determine the reason for this relation as well as its dependence on the commute network structure and epidemic parameters. This study shows that the model based on the connection between the population size classes is sufficient to predict both global and local epidemic dynamics in metropolitan area. Moreover, the clear relation of the time taken by the epidemic to reach each local population can be used as a novel measure for intervention; this enables efficient intervention strategies in each local population prior to the actual arrival.
Conflict of interest statement
Figures
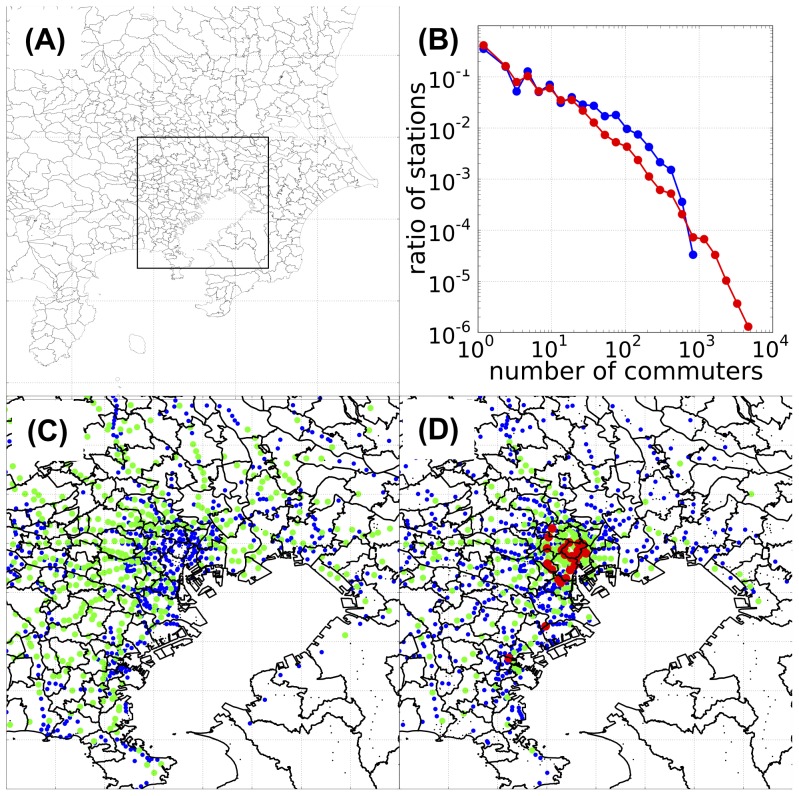
 commuters; blue,
  commuters; green,
  commuters; red,
  commuters. All numbers are from the 139,841 collected questionnaires of UTC. The red-colored stations in the middle of (D) correspond to Tokyo's inner urban area (along the loop of the Yamanote line); the 2 red stations in the lower left of (D) are the Kawasaki and Yokohama stations. The longitude and latitude of each station were acquired from the Station Database [
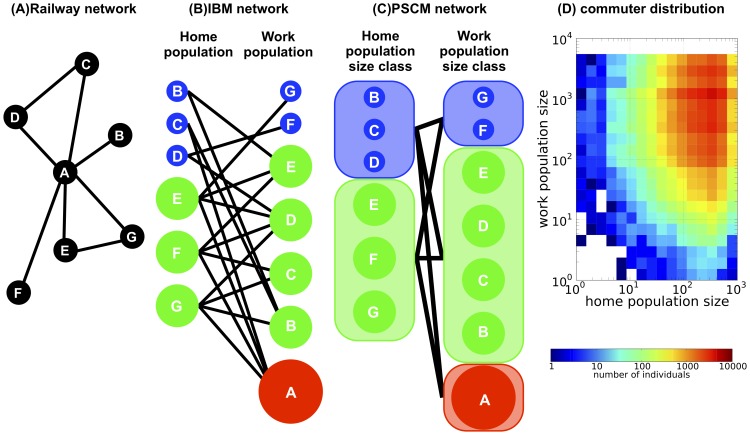
 of commuters that live in a home population of size class
  and commute to a work population of size class
  is plotted as a density plot. The data were obtained from the Urban Transportation Census (UTC) commute data (Ministry of Land, Infrastructure, Transport and Tourism, The 10th Urban Transportation Census Report, 2007; in Japanese).
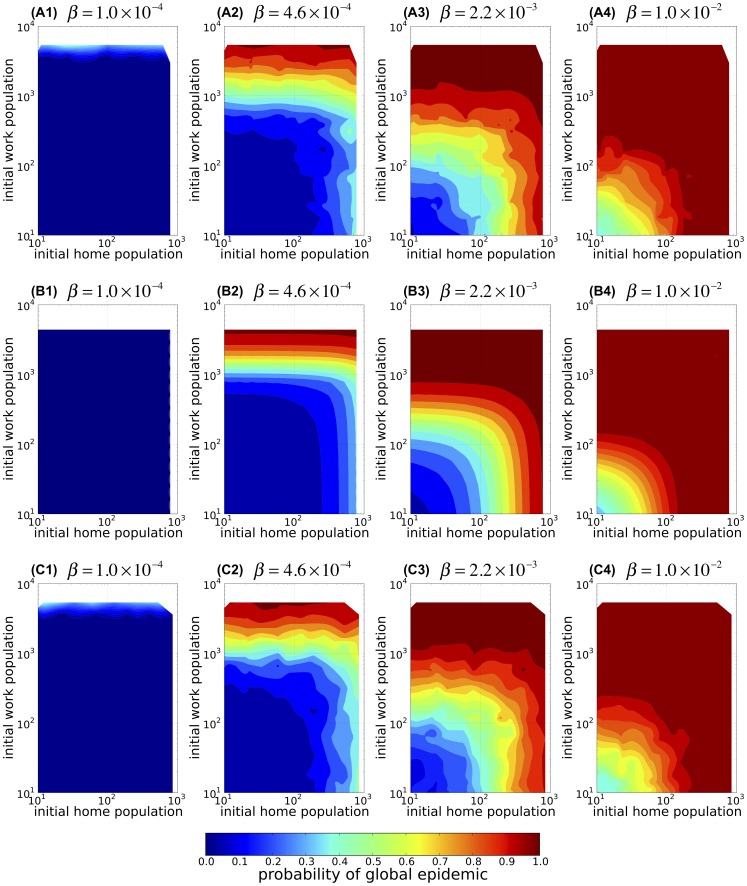
 , as a function of the home population size (horizontal axis; initial home population) and work population size (vertical axis; initial work population) of the initially infected host for various infection rate
  . (A1–4) The results of the individual-based model (IBM) simulations of the spread of infectious disease over the commute network of the Tokyo metropolitan area which starts with a single infectious individual commuting from a randomly chosen home population to a randomly chosen work population. Each panel corresponds to a different infection rate, and the population sizes are plotted on logarithmic scales. (B1–4) The corresponding results obtained using a branching process formula in the population size class model (PSCM). (C1–4) The corresponding results of the IBM simulations using the random reconnection model (RRM). In each panel, the contour plot represents interpolation of the results calculated using the data of 184 combinations of initial home and work population sizes.
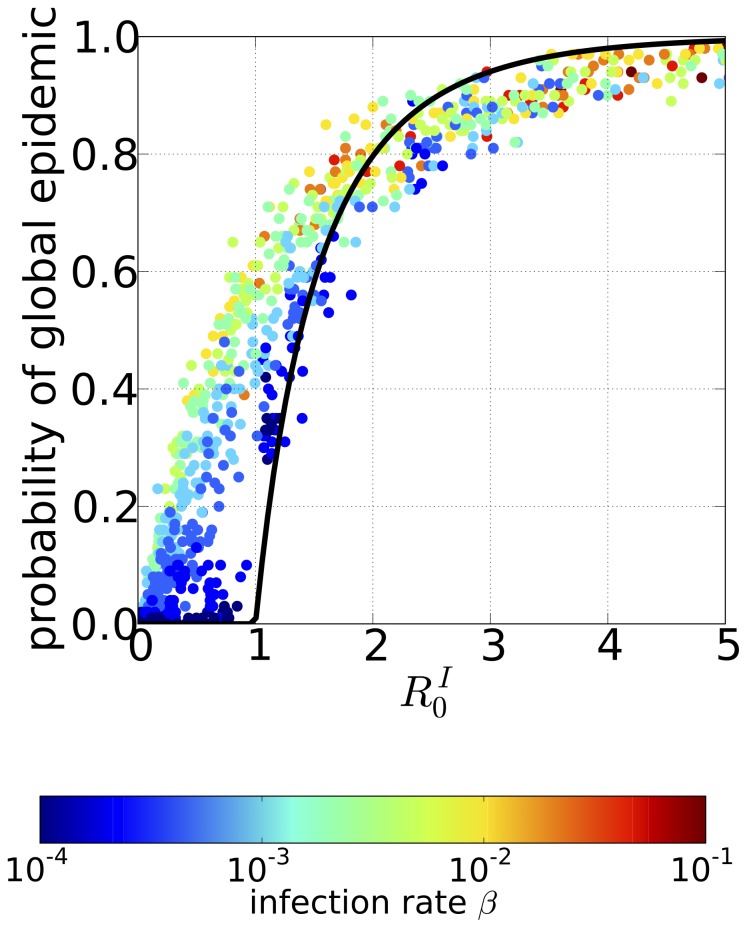
 , where the independent variable is the sum of the single population basic reproduction ratios of the initial home and work populations (
 and
and  : home and work population sizes of the initially infected individual, respectively). Each point corresponds to a different set of epidemic parameters, and the color represents the infection rate
  . Black line, the probability of a global epidemic in the single population model with population size
  , i.e., that from
  (main text for details).
 . (A1) and (B1): results observed in the individual-based model (IBM) simulations; each point gives the Monte Carlo ensemble average value corresponding to different epidemic parameters, and the color indicates the sum of the sizes of the initially infected home and work populations. Here, the cases for initial extinction of disease are excluded from the ensemble. (A2) and (B2): corresponding results from the population size class model (PSCM) calculations.
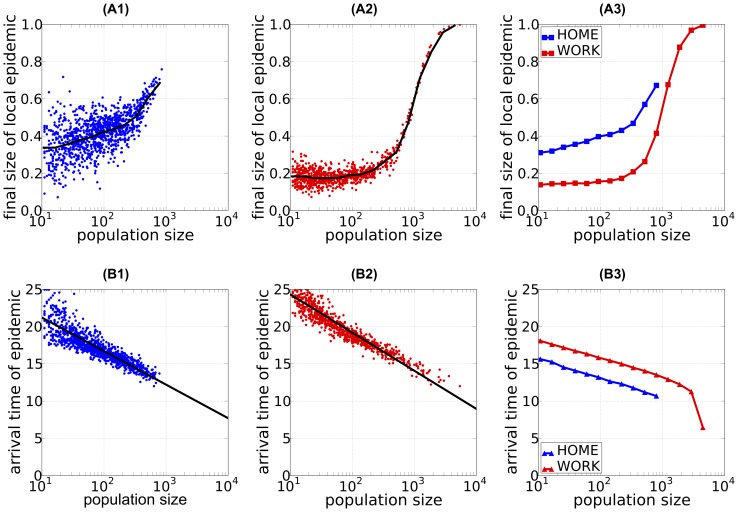
 in the
  -th home population with population size
  ,
,  , was highly significant, with a P-value of
  in the
  test (
 with the degrees of freedom (1, 1084)),
  . The estimated intercept
  and slope
  and their
  confidence intervals (CIs) are
  (
( CI) and
  (
( CI). The same was true for the arrival times in the work population; the regression
  was highly significant (
 ,
,  with
with  ), with estimated intercept and slope
  (
( CI) and
  (
( CI), respectively. (A3) and (B3): corresponding results obtained from the population size class model (PSCM); the blue line shows the result for the home population and the red line the result for the work population (refer main text for details). The infection rate was
  . A person commuting from “Gyotoku” station to “Aoyama-itchome” station was designated the initially infectious individual.
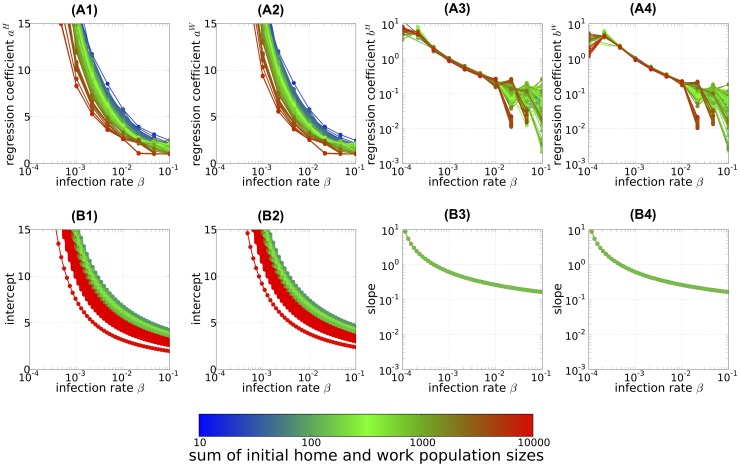
 and
and  , respectively. (A3) and (A4): estimated (sign reversed) slopes
  and
and  , respectively. All regressions were statistically significant according to the P-value of the regression coefficient (
 ).
).References
-
- Longini IM, Nizam A, Xu S, Ungchusak K, Hanshaoworakul W, et al. (2005) Containing pandemic influenza at the source. Science (New York, NY) 309: 1083–7. - PubMed
-
- Ferguson NM, Cummings DaT, Cauchemez S, Fraser C, Riley S, et al. (2005) Strategies for containing an emerging influenza pandemic in Southeast Asia. Nature 437: 209–14. - PubMed
-
- Ohkusa Y, Sugawara T (2007) Application of an individual-based model with real data for transportation mode and location to pandemic influenza. Journal of infection and chemotherapy: official journal of the Japan Society of Chemotherapy 13: 380–9. - PubMed
Publication types
MeSH terms
LinkOut - more resources
Full Text Sources
Other Literature Sources
