

sdf1 Expression reveals a source of perivascular-derived mesenchymal stem cells in zebrafish
- PMID: 24905975
- PMCID: PMC4165765
- DOI: 10.1002/stem.1758
sdf1 Expression reveals a source of perivascular-derived mesenchymal stem cells in zebrafish
Abstract
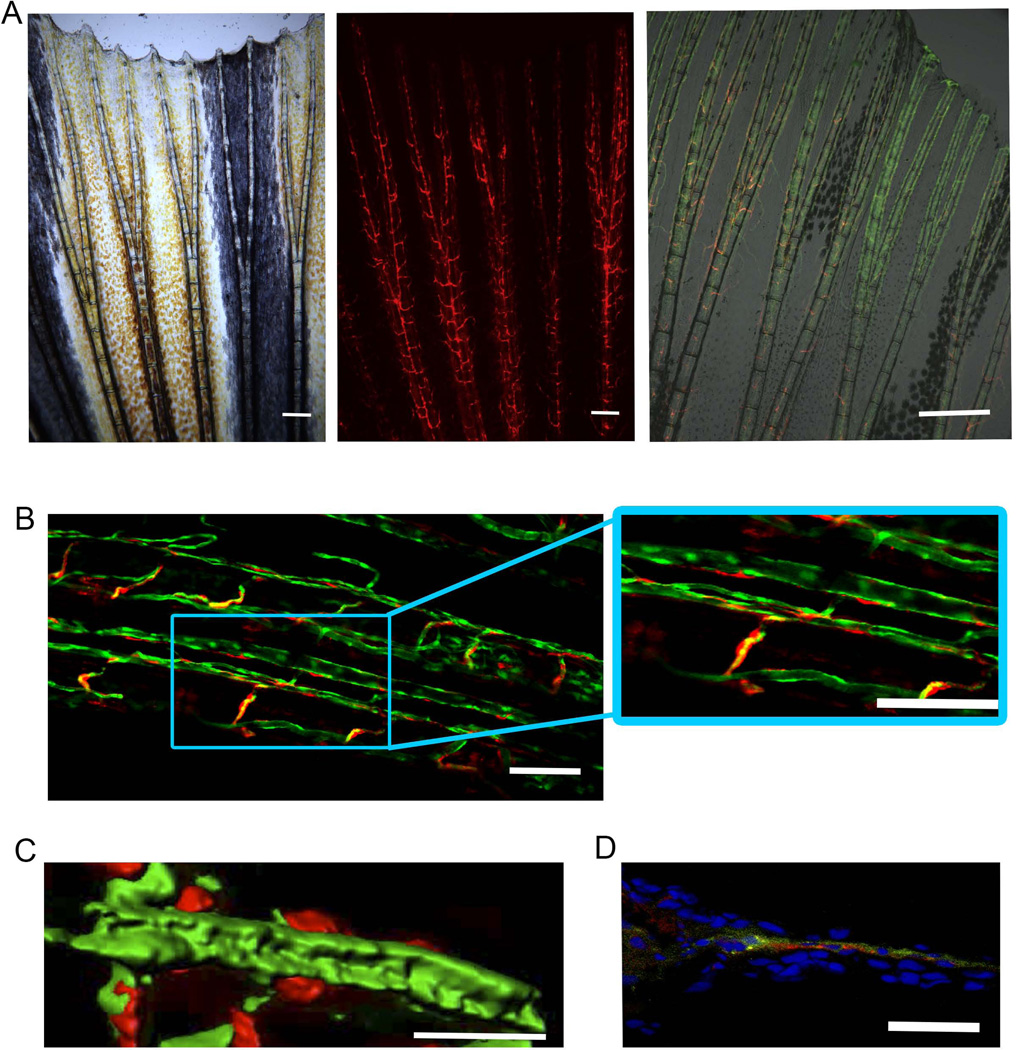
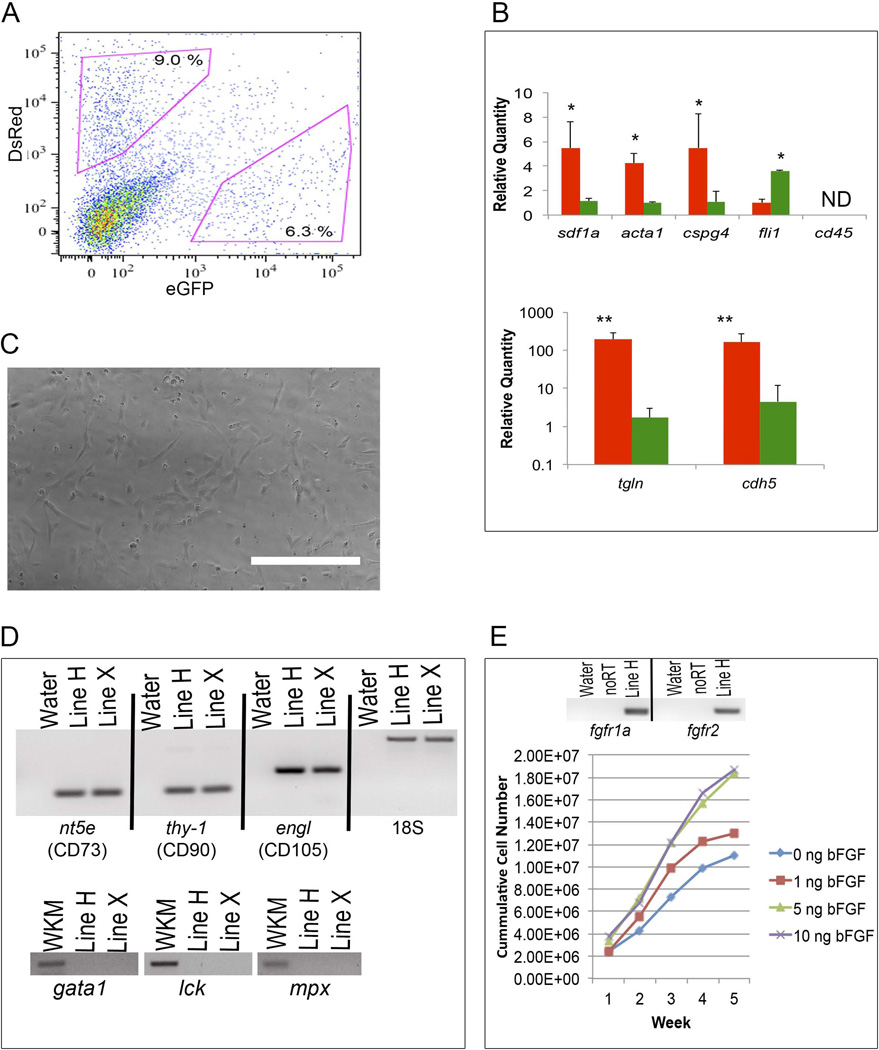
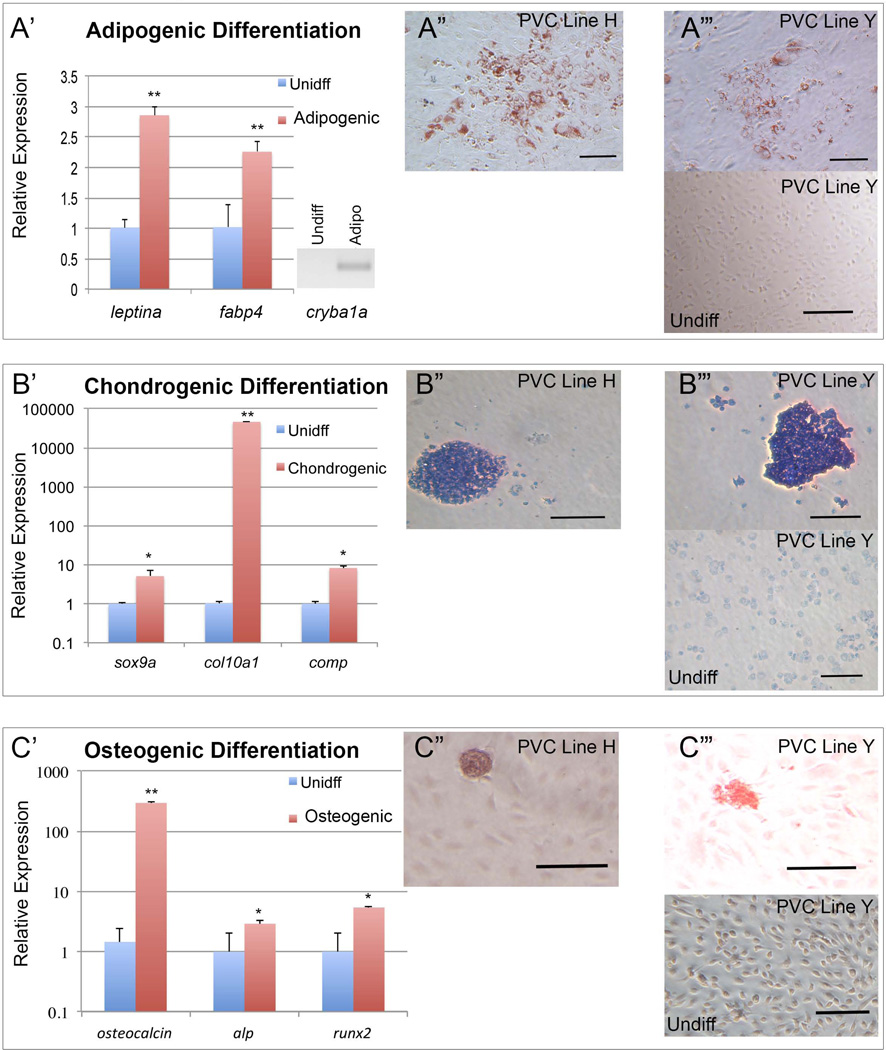
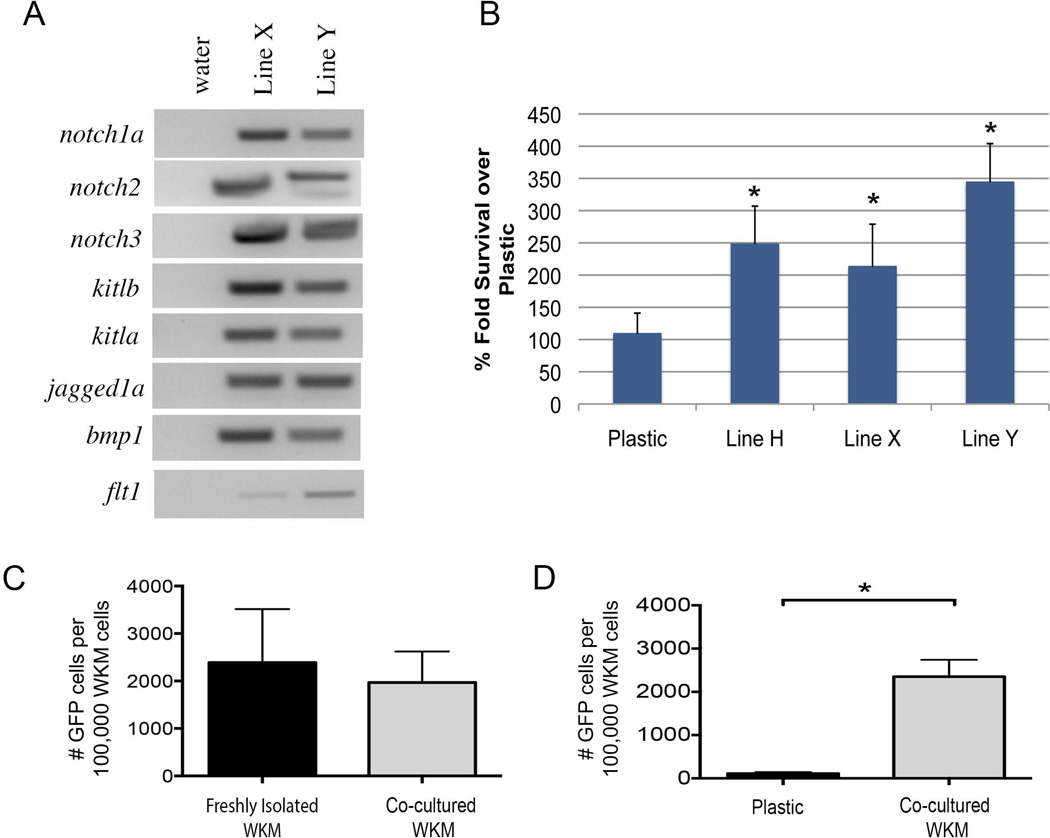
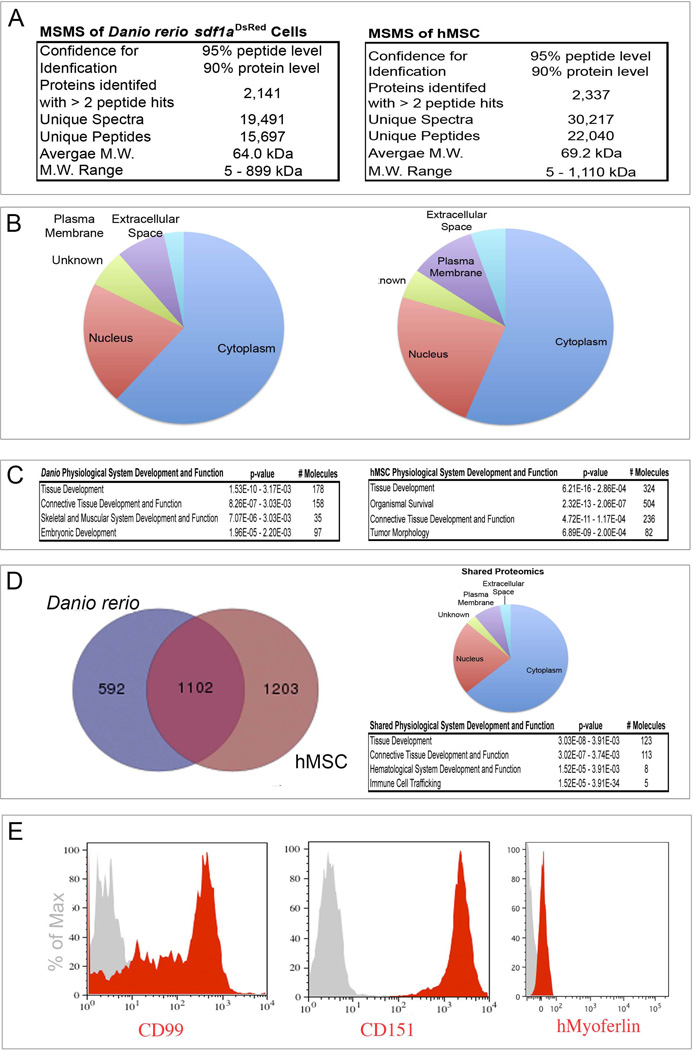
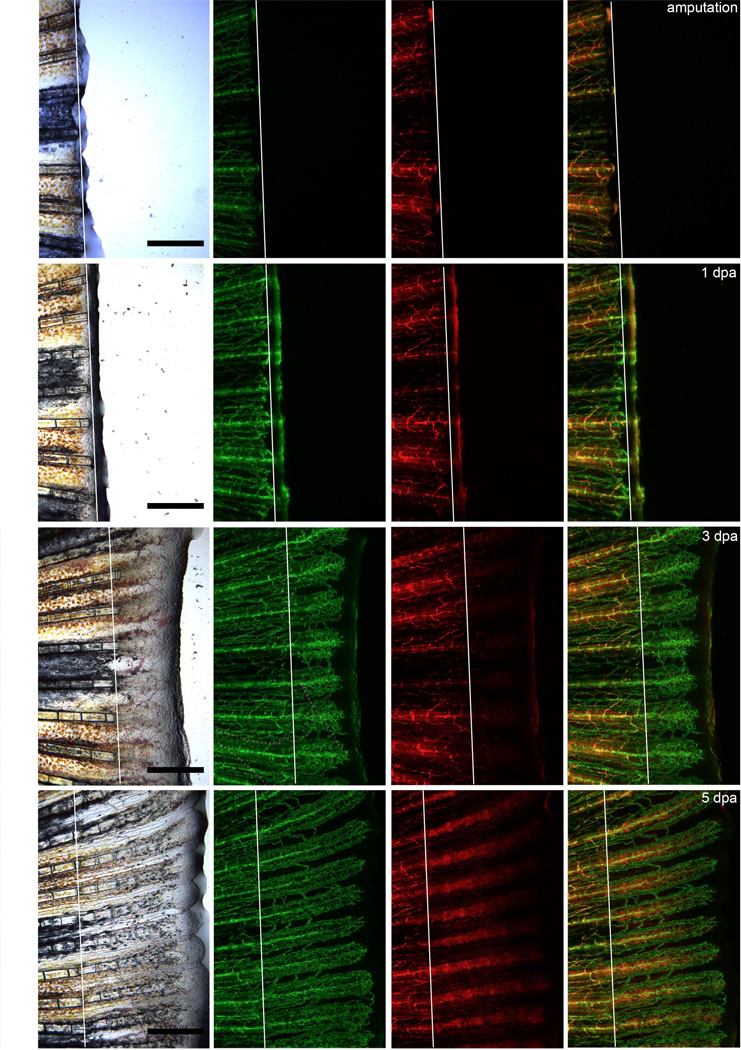
There is accumulating evidence that mesenchymal stem cells (MSCs) have their origin as perivascular cells (PVCs) in vivo, but precisely identifying them has been a challenge, as they have no single definitive marker and are rare. We have developed a fluorescent transgenic vertebrate model in which PVC can be visualized in vivo based upon sdf1 expression in the zebrafish. Prospective isolation and culture of sdf1(DsRed) PVC demonstrated properties consistent with MSC including prototypical cell surface marker expression; mesodermal differentiation into adipogenic, osteogenic, and chondrogenic lineages; and the ability to support hematopoietic cells. Global proteomic studies performed by two-dimensional liquid chromatography and tandem mass spectrometry revealed a high degree of similarity to human MSC (hMSC) and discovery of novel markers (CD99, CD151, and MYOF) that were previously unknown to be expressed by hMSC. Dynamic in vivo imaging during fin regeneration showed that PVC may arise from undifferentiated mesenchyme providing evidence of a PVC-MSC relationship. This is the first model, established in zebrafish, in which MSC can be visualized in vivo and will allow us to better understand their function in a native environment.
Keywords: Angiogenesis; Mesenchymal stem cells; Multipotential differentiation; Pericytes; zebrafish.
© 2014 AlphaMed Press.
Conflict of interest statement
Each author declares no conflict of interest.
Figures
Similar articles
-
A mesoderm-derived precursor for mesenchymal stem and endothelial cells.Cell Stem Cell. 2010 Dec 3;7(6):718-29. doi: 10.1016/j.stem.2010.11.011. Cell Stem Cell. 2010. PMID: 21112566 Free PMC article.
-
Small molecule mesengenic induction of human induced pluripotent stem cells to generate mesenchymal stem/stromal cells.Stem Cells Transl Med. 2012 Feb;1(2):83-95. doi: 10.5966/sctm.2011-0022. Epub 2012 Feb 7. Stem Cells Transl Med. 2012. PMID: 23197756 Free PMC article.
-
Human mesenchymal stem cells express neuronal markers after osteogenic and adipogenic differentiation.Cell Mol Biol Lett. 2013 Jun;18(2):163-86. doi: 10.2478/s11658-013-0083-2. Epub 2013 Feb 21. Cell Mol Biol Lett. 2013. PMID: 23430457 Free PMC article.
-
Natural history of mesenchymal stem cells, from vessel walls to culture vessels.Cell Mol Life Sci. 2014 Apr;71(8):1353-74. doi: 10.1007/s00018-013-1462-6. Epub 2013 Oct 25. Cell Mol Life Sci. 2014. PMID: 24158496 Free PMC article. Review.
-
Defining adipose tissue-derived stem cells in tissue and in culture.Histol Histopathol. 2010 Jun;25(6):807-15. doi: 10.14670/HH-25.807. Histol Histopathol. 2010. PMID: 20376787 Review.
Cited by
-
Zebrafish Caudal Haematopoietic Embryonic Stromal Tissue (CHEST) Cells Support Haematopoiesis.Sci Rep. 2017 Mar 16;7:44644. doi: 10.1038/srep44644. Sci Rep. 2017. PMID: 28300168 Free PMC article.
-
Zebrafish Vascular Development: General and Tissue-Specific Regulation.J Lipid Atheroscler. 2021 May;10(2):145-159. doi: 10.12997/jla.2021.10.2.145. Epub 2021 Mar 2. J Lipid Atheroscler. 2021. PMID: 34095009 Free PMC article. Review.
-
An irradiated marrow niche reveals a small noncollagenous protein mediator of homing, dermatopontin.Blood Adv. 2021 Sep 28;5(18):3609-3622. doi: 10.1182/bloodadvances.2021004475. Blood Adv. 2021. PMID: 34448828 Free PMC article.
-
Cellular diversity of the regenerating caudal fin.Sci Adv. 2020 Aug 12;6(33):eaba2084. doi: 10.1126/sciadv.aba2084. eCollection 2020 Aug. Sci Adv. 2020. PMID: 32851162 Free PMC article.
-
Mesenchymal stem cells over-expressing cxcl12 enhance the radioresistance of the small intestine.Cell Death Dis. 2018 Feb 5;9(2):154. doi: 10.1038/s41419-017-0222-1. Cell Death Dis. 2018. PMID: 29402989 Free PMC article.
References
-
- Prunet-Marcassus B, Cousin B, Caton D, et al. From heterogeneity to plasticity in adipose tissues: site-specific differences. Exp Cell Res. 2006;312:727–736. - PubMed
-
- da Silva Meirelles L, Caplan AI, Nardi NB. In search of the in vivo identity of mesenchymal stem cells. Stem Cells. 2008;26:2287–2299. - PubMed
-
- Corselli M, Chen CW, Crisan M, et al. Perivascular ancestors of adult multipotent stem cells. Arterioscler Thromb Vasc Biol. 2010;30:1104–1109. - PubMed
-
- Crisan M, Yap S, Casteilla L, et al. A perivascular origin for mesenchymal stem cells in multiple human organs. Cell Stem Cell. 2008;3:301–313. - PubMed
-
- Zannettino AC, Paton S, Arthur A, et al. Multipotential human adipose-derived stromal stem cells exhibit a perivascular phenotype in vitro and in vivo. J Cell Physiol. 2008;214:413–421. - PubMed
Publication types
MeSH terms
Substances
Grants and funding
LinkOut - more resources
Full Text Sources
Other Literature Sources
Molecular Biology Databases
Miscellaneous
