. 2014 Jul:61:97-109.
doi: 10.1016/j.mcn.2014.06.001. Epub 2014 Jun 4.

Reovirus-mediated induction of ADAR1 (p150) minimally alters RNA editing patterns in discrete brain regions

Affiliations

Reovirus-mediated induction of ADAR1 (p150) minimally alters RNA editing patterns in discrete brain regions

Jennifer L Hood et al. Mol Cell Neurosci. 2014 Jul.

Abstract

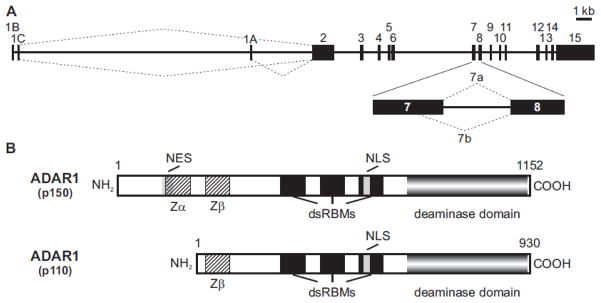
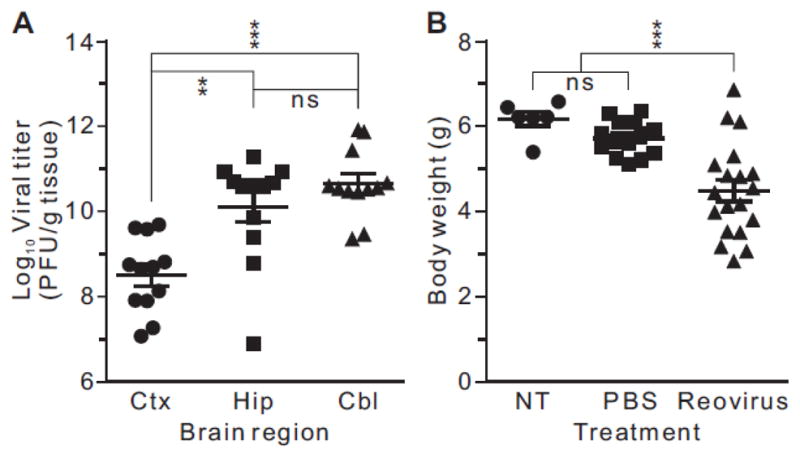
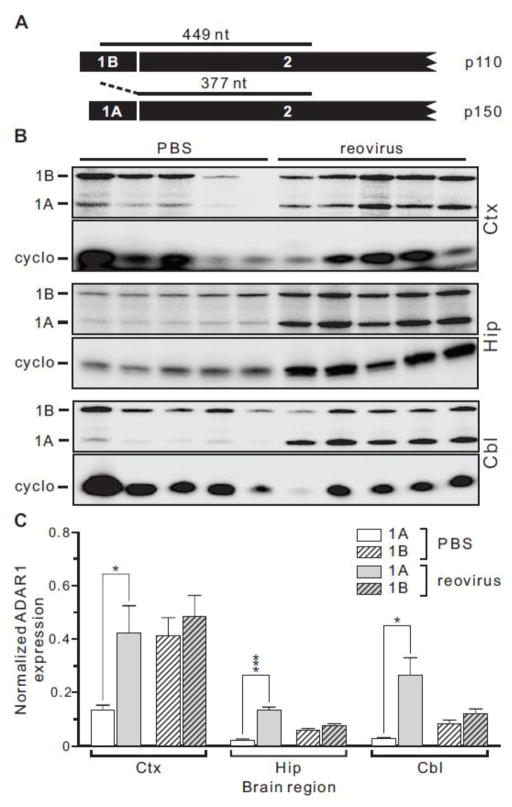
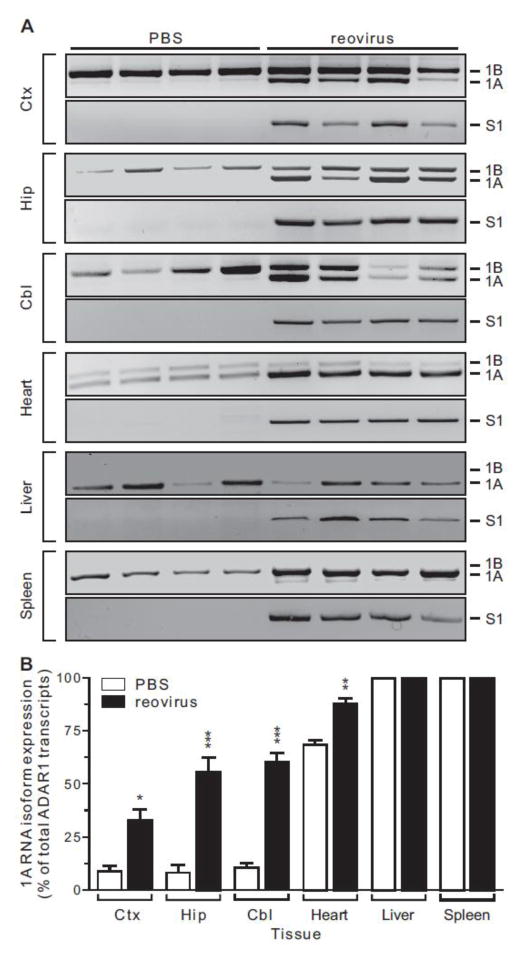
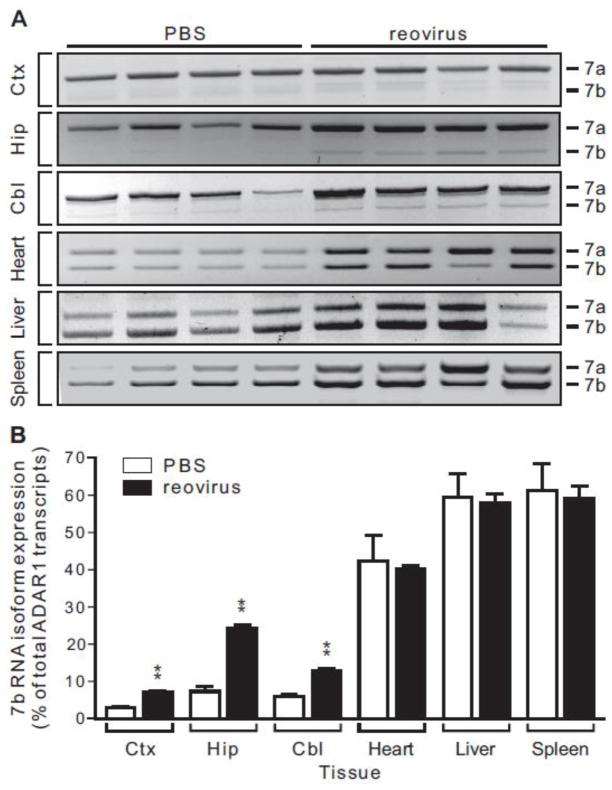
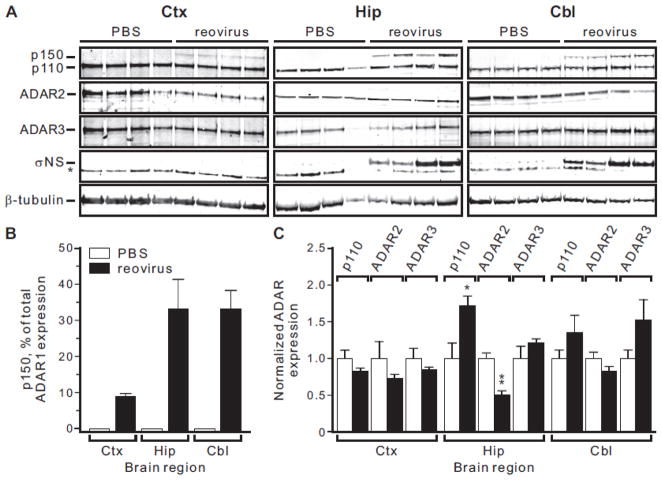
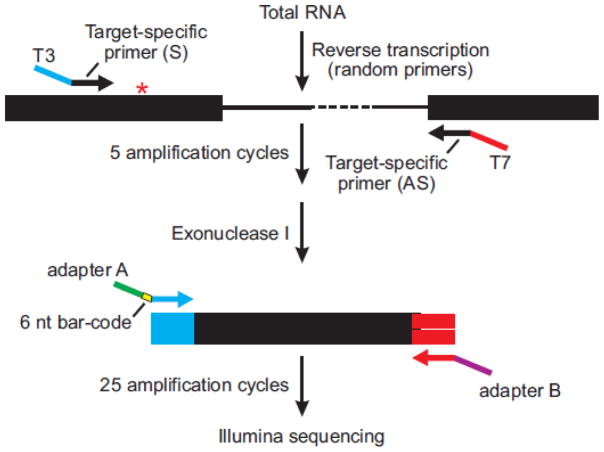
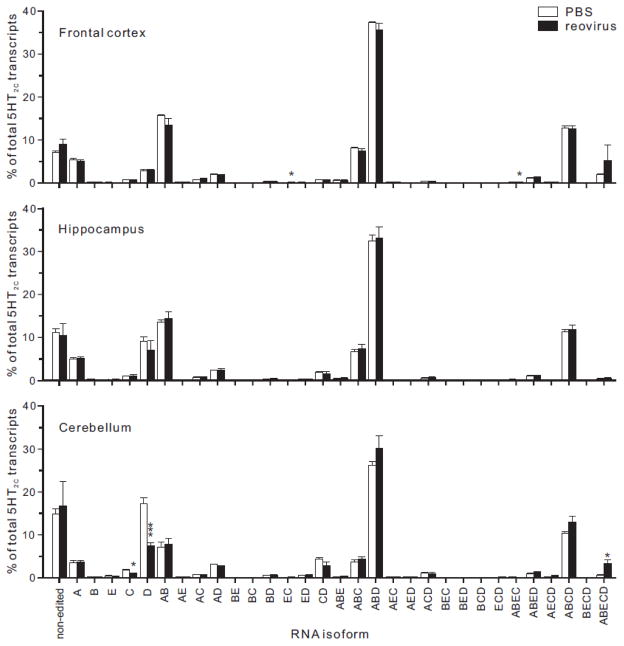
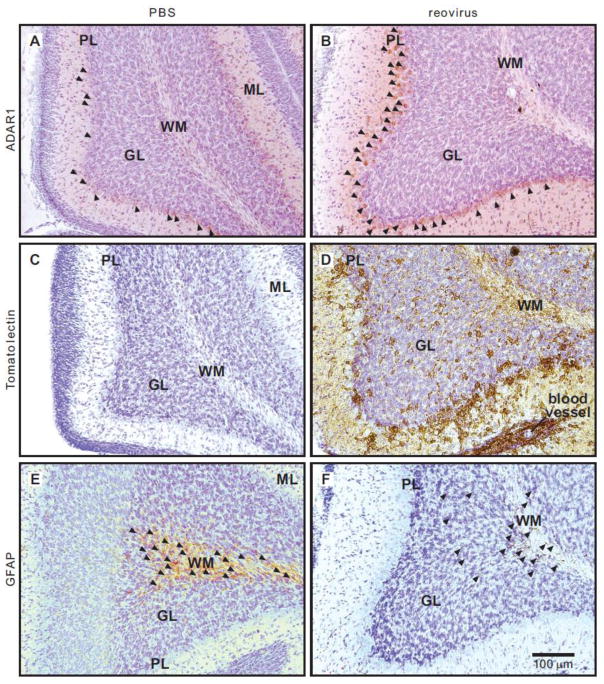
Transcripts encoding ADAR1, a double-stranded, RNA-specific adenosine deaminase involved in the adenosine-to-inosine (A-to-I) editing of mammalian RNAs, can be alternatively spliced to produce an interferon-inducible protein isoform (p150) that is up-regulated in both cell culture and in vivo model systems in response to pathogen or interferon stimulation. In contrast to other tissues, p150 is expressed at extremely low levels in the brain and it is unclear what role, if any, this isoform may play in the innate immune response of the central nervous system (CNS) or whether the extent of editing for RNA substrates critical for CNS function is affected by its induction. To investigate the expression of ADAR1 isoforms in response to viral infection and subsequent alterations in A-to-I editing profiles for endogenous ADAR targets, we used a neurotropic strain of reovirus to infect neonatal mice and quantify A-to-I editing in discrete brain regions using a multiplexed, high-throughput sequencing strategy. While intracranial injection of reovirus resulted in a widespread increase in the expression of ADAR1 (p150) in multiple brain regions and peripheral organs, significant changes in site-specific A-to-I conversion were quite limited, suggesting that steady-state levels of p150 expression are not a primary determinant for modulating the extent of editing for numerous ADAR targets in vivo.

Keywords: Cerebellum; Frontal cortex; High-throughput sequencing; Hippocampus; Interferon.


Figures

Figure 1
Figure 1. Generation of multiple mouse ADAR1 isoforms by alternative splicing
A) A schematic representation of the mouse ADAR1 gene is shown indicating the presence of alternative exon 1 sequences that can generate constitutive (1B and 1C) and interferon-induced (1A) mRNA isoforms by alternative splicing to encode distinct p110 and p150 proteins, respectively; kb, kilobase. An alternative splicing event in exon 7 leads to additional ADAR1 RNA and protein diversity, generating RNA isoforms (7a and 7b) encoding proteins differing in size by 26 amino acids. B) The major mouse ADAR1 protein isoforms are presented indicating their relative size in amino acids, as well as the location of the putative nuclear localization (NLS) and export (NES) signals, Z-DNA binding domains (Zα and Zβ), dsRNA-binding motifs (dsRBMs) and the catalytic adenosine deaminase domain.
Figure 2
Figure 2. Viral titers and body weights of mice infected with T3D reovirus
A) Reovirus titers in dissected brain regions (Ctx, frontal cortex; Hip, hippocampus; Cbl, cerebellum) were determined by plaque assay at the time of sacrifice. Means ± SEM (n = 12 for each brain region) were statistically compared by mixed models ANOVA (repeated measures) with Tukey’s adjustment; ns, not significant, **p<0.01, ***p<0.001. B) The body weights of control mice (no treatment) or animals intracranially-injected with PBS or T3D reovirus at postnatal day 2 (P2) were determined at the time of sacrifice (postnatal day 13). Means ± SEM (no treatment, n = 6; PBS, n = 14; reovirus, n = 19) were statistically compared by ANOVA with Dunnett’s multiple comparison test; ns, not significant, ***p<0.001.
Figure 3
Figure 3. Widespread increase in ADAR1A RNA expression in response to reovirus infection
A) A schematic diagram of an antisense riboprobe specific for the ADAR1B mRNA is shown as well as the expected sizes of ribonuclease protection products generated from 1B- and 1A-containing ADAR1 transcripts. B) Ribonuclease protection analysis of total ADAR1 RNA expression in dissected brain regions for individual mice intracranially-injected with PBS (control) or T3D reovirus. Ctx, frontal cortex; Hip, hippocampus; Cbl, cerebellum. The migration positions for protected fragments generated from ADAR1A and ADAR1B RNAs are indicated as well as a cyclophilin loading control. C) Quantification of ribonuclease protection analysis. Band intensities for ADAR1A and ADAR1B RNA isoforms were normalized to the internal cyclophilin control for each dissected brain region. Means ± SEM (n ≥ 5 animals/treatment group) were statistically compared by unpaired t-test; *p ≤ 0.05, ***p ≤ 0.001.
Figure 4
Figure 4. Semi-quantitative analysis of ADAR1A (p150) and ADAR1B (p110) RNA expression in brain and peripheral tissues
A) ADAR1 expression was quantified by end-point RT-PCR from multiple tissues in control and reovirus-infected animals using primers in exons 1A, 1B and 2, and the expected migration positions of the PCR amplicons for each alternatively spliced ADAR1 isoform are indicated. The presence of reovirus-derived S1 RNA was also determined. B) Quantification of ADAR1 alternative splicing was assessed by ethidium bromide fluorescence of RT-PCR amplicons. Means ± SEM (n = 4 animals/treatment group) were statistically compared by unpaired t-test; *p<0.05, **p ≤ 0.01, ***p ≤ 0.001.
Figure 5
Figure 5. Differential expression of ADAR1 exon 7 splice variants in response to reovirus infection
A) The expression of ADAR1 isoforms using alternative 5′-splice sites in exon 7 was quantified by end-point RT-PCR from multiple tissues in control and reovirus-infected animals using primers in exons 6 and 8; the expected migration positions of the PCR amplicons for each alternatively spliced ADAR1 isoform are indicated. B) The relative ratio of ADAR1 alternatively spliced isoforms was quantified by ethidium bromide fluorescence of RT-PCR products. Means ± SEM (n = 4 animals/treatment group) were statistically compared by unpaired t-test; *p ≤ 0.05, **p ≤ 0.01.
Figure 6
Figure 6. Analysis of ADAR protein expression in response to reovirus infection
A) Representative Western blots of ADAR protein expression in whole cell lysates isolated from dissected brain regions of individual mice are shown; Ctx, frontal cortex; Hip, hippocampus; Cbl, cerebellum. The migration positions for ADAR1 protein isoforms (p150 and p110), ADAR2, ADAR3 and a β-tubulin loading control are shown. Western blotting analysis for a reovirus-specific protein (σNS) is also shown; a non-specific band in the (σNS) blots is indicated by an asterisk. B and C) Quantitative analysis of alterations in ADAR1 isoform expression for control (□) and reovirus-infected (■) mice. Due to the absence of detectable p150 in control animals, data are presented as the percentage of total ADAR1 protein expression represented by p150 (B) or normalized to an internal β-tubulin control (C). Means ± SEM (n = 4 animals/treatment group) were statistically compared by unpaired t-test; *p ≤ 0.05, **p ≤ 0.01, ***p ≤ 0.001.
Figure 7
Figure 7. Deep sequencing strategy for multiplex quantification of editing profiles
A schematic diagram is presented for RT-PCR amplification of a region of an mRNA target flanking an A-to-I editing site (✱). In general, target-specific primers in adjacent exons containing either T3 (blue) or T7 (red) RNA polymerase promoter extensions for the sense and antisense primers, respectively (Supplementary Table 1) were used for PCR amplification (5 cycles) before digestion of the remaining single-stranded primers using Exonuclease I. A second round of amplification (25 cycles) was performed with universal primers in which the oligonucleotide contained sequences matching the T3 promoter, one of 24 unique 6-nt barcode sequences (yellow) for sample identification, as well as an adapter sequence (Adapter A; green) or sequences matching the T7 and an adapter sequence (Adapter B; purple) for high-throughput single-end sequencing on the Illumina platform.
Figure 8
Figure 8. Analysis of brain region-specific 5HT2C RNA editing to reo-profiles in response virus infection
Editing profiles in dissected brain regions were determined by high-throughput sequence analysis (see Figure 7) and the thirty-two possible 5HT2C RNA isoforms resulting from RNA editing are represented as the percentage of total 5HT2C sequence reads (see Supplementary Table 3) for control (□) or reovirus-infected (■) animals. Means ± SEM (n≥4) were statistically compared by unpaired t-test; *p<0.05, ***p<0.001.
Figure 9
Figure 9. Immunohistochemical analysis of ADAR1 expression in reovirus-infected cere-bella
Coronal sections of cerebellum (30 μm) from PBS and reovirus-inoculated mice were labeled for ADAR1 expression along with microglia and astrocytes. A and B) ADAR1 immuno-reactivity (arrow heads) in the Purkinje cell layer (PL) from PBS and reovirus–infected animals. C and D) Cytochemical visualization of microglia using biotinylated tomato lectin. E and F) Immunolocalization of astrocytes (arrow heads) in the cerebella of control and reovirus–infected mice using an antiserum directed against glial fibrillary acidic protein (GFAP). All tissue sections were counterstained with cresyl violet to reveal cerebellar morphology. The scale bar for all panels (A–F) is presented at the bottom right in panel F; white matter (WM), granule cell layer (GL), Purkinje cell layer (PL), molecular layer (ML).

Similar articles

Cited by

References

    1. Abbas AI, Urban DJ, Jensen NH, Farrell MS, Kroeze WK, Mieczkowski P, Wang Z, Roth BL. Assessing serotonin receptor mRNA editing frequency by a novel ultra high-throughput sequencing method. Nucleic acids research. 2010;38:e118. - PMC - PubMed
    1. Antar AA, Konopka JL, Campbell JA, Henry RA, Perdigoto AL, Carter BD, Pozzi A, Abel TW, Dermody TS. Junctional adhesion molecule-A is required for hematogenous dissemination of reovirus. Cell host & microbe. 2009;5:59–71. - PMC - PubMed
    1. Athanasiadis A. Zalpha-domains: at the intersection between RNA editing and innate immunity. Semin Cell Dev Biol. 2012;23:275–280. - PubMed
    1. Balik A, Penn AC, Nemoda Z, Greger IH. Activity-regulated RNA editing in select neuronal subfields in hippocampus. Nucleic acids research. 2013;41:1124–1134. - PMC - PubMed
    1. Becker MM, Peters TR, Dermody TS. Reovirus sigma NS and mu NS proteins form cytoplasmic inclusion structures in the absence of viral infection. Journal of virology. 2003;77:5948–5963. - PMC - PubMed

Publication types

MeSH terms

LinkOut - more resources