. 2014 Dec;8(12):2380-96.
doi: 10.1038/ismej.2014.79. Epub 2014 Jun 6.

Distinct signatures of host-microbial meta-metabolome and gut microbiome in two C57BL/6 strains under high-fat diet

Affiliations

Distinct signatures of host-microbial meta-metabolome and gut microbiome in two C57BL/6 strains under high-fat diet

Alesia Walker et al. ISME J. 2014 Dec.

Abstract

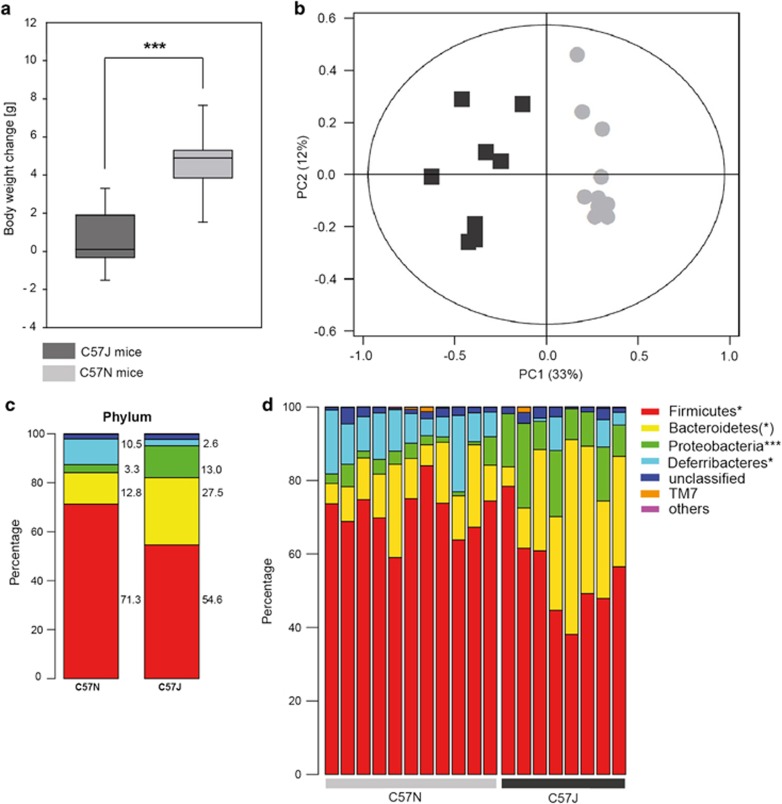
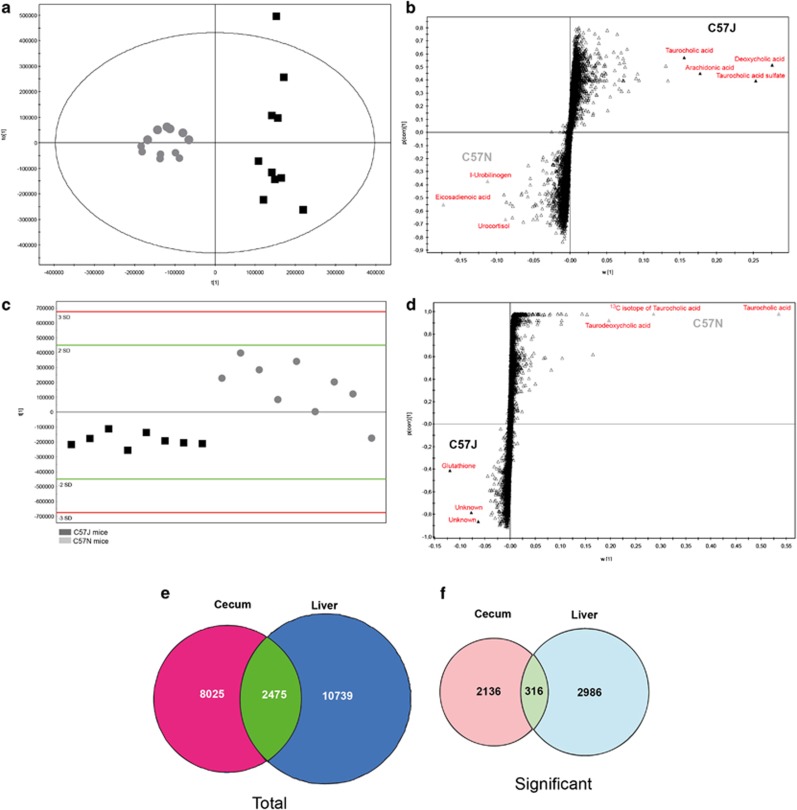
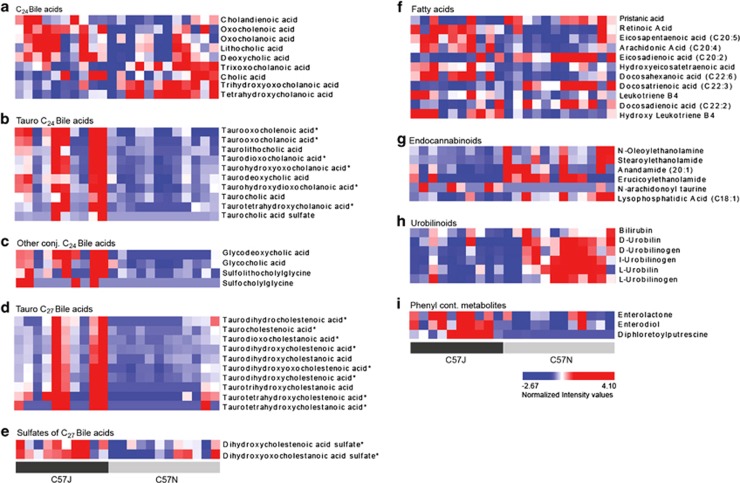
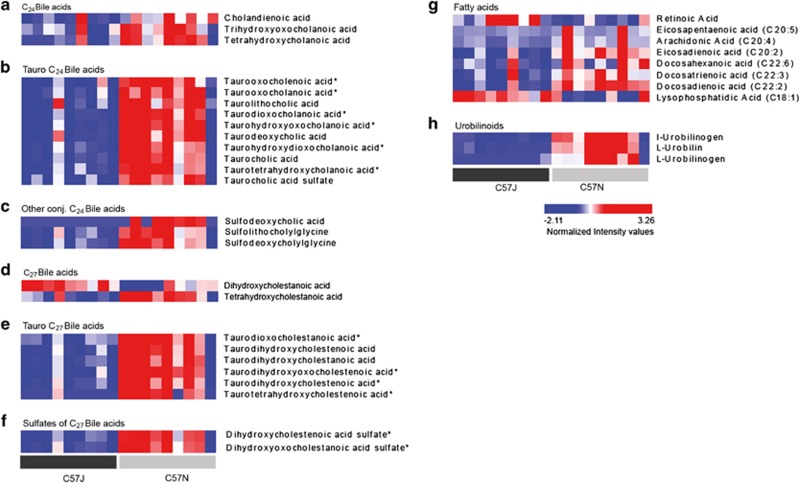
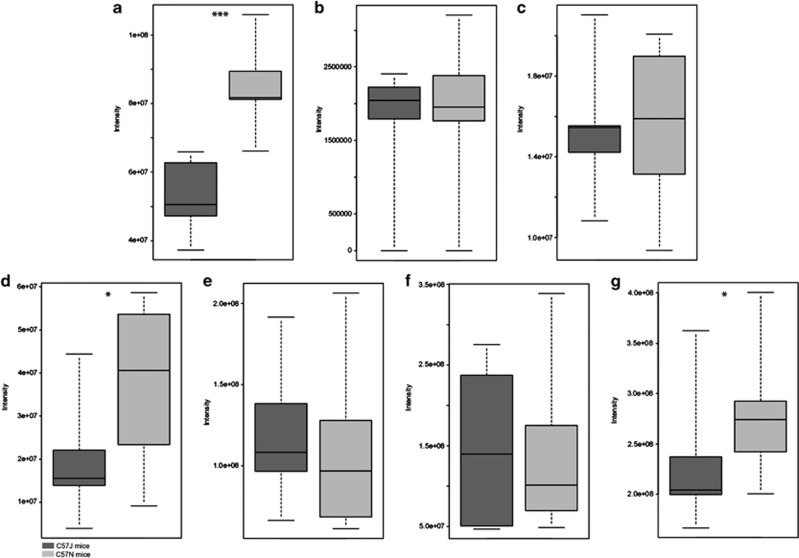
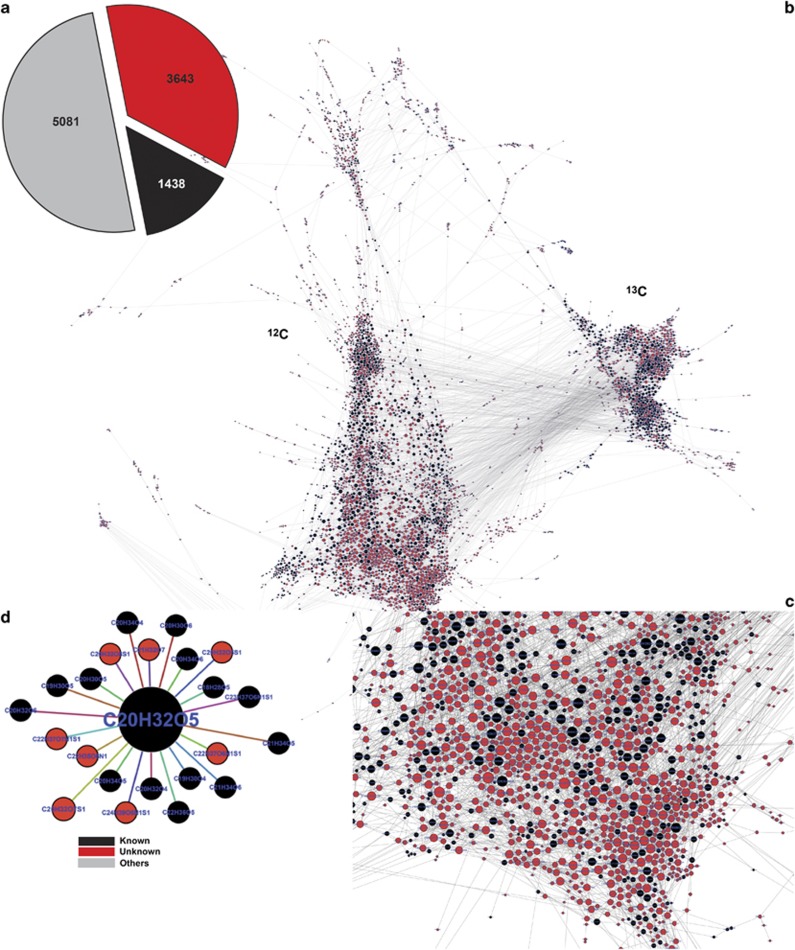
A combinatory approach using metabolomics and gut microbiome analysis techniques was performed to unravel the nature and specificity of metabolic profiles related to gut ecology in obesity. This study focused on gut and liver metabolomics of two different mouse strains, the C57BL/6J (C57J) and the C57BL/6N (C57N) fed with high-fat diet (HFD) for 3 weeks, causing diet-induced obesity in C57N, but not in C57J mice. Furthermore, a 16S-ribosomal RNA comparative sequence analysis using 454 pyrosequencing detected significant differences between the microbiome of the two strains on phylum level for Firmicutes, Deferribacteres and Proteobacteria that propose an essential role of the microbiome in obesity susceptibility. Gut microbial and liver metabolomics were followed by a combinatory approach using Fourier transform ion cyclotron resonance mass spectrometry (FT-ICR-MS) and ultra performance liquid chromatography time of tlight MS/MS with subsequent multivariate statistical analysis, revealing distinctive host and microbial metabolome patterns between the C57J and the C57N strain. Many taurine-conjugated bile acids (TBAs) were significantly elevated in the cecum and decreased in liver samples from the C57J phenotype likely displaying different energy utilization behavior by the bacterial community and the host. Furthermore, several metabolite groups could specifically be associated with the C57N phenotype involving fatty acids, eicosanoids and urobilinoids. The mass differences based metabolite network approach enabled to extend the range of known metabolites to important bile acids (BAs) and novel taurine conjugates specific for both strains. In summary, our study showed clear alterations of the metabolome in the gastrointestinal tract and liver within a HFD-induced obesity mouse model in relation to the host-microbial nutritional adaptation.


Figures

Figure 1
Figure 1
HF feeding of 3 weeks impacts body weight in C57N mice compared with the C57J and influences the bacterial community in the gut. (a) Significant body weight changes between C57J and C57N mice, P-value *<0.05, **<0.01, ***<0.001, (Student's t-test) (b) Bacterial community changes between C57J (black rectangle) and C57N (gray dots)) mice, originated from principal component analysis (PCA). The analysis was performed on data based on relative abundance and Hellinger transformed 16S-rRNA data of classified OTUs with >97% identity. (c) Cecal bacterial profiles on phylum level of C57J and C57N mice, displaying relative abundance of partial sequences of bacterial 16S-rRNA genes. Individual phylum levels of each mouse are shown in d. Classification was done at the phylum level using mothur with a modified 16S-rRNA gene database from RDP: P-value: *<0.05, **<0.01, ***<0.001 (Wilcoxon–Mann–Whitney test).
Figure 2
Figure 2
Non-targeted metabolomics performed with FT-ICR-MS reveals microbial and host related metabolome changes. (a) OPLS-DA scores scatter plot of cecal meta-metabolome (a) and liver metabolome (c) from C57J and C57N mice. (b) S-plot illustrated the putative metabolites responsible for the discrimination of C57J and C57N mice concerning the cecal (b) or liver metabolome (d). Venn diagram of total count of mass signals (e) detected commonly or uniquely in cecum or liver samples. Venn diagram of significant mass signals (f) detected commonly or uniquely in cecum or liver samples.
Figure 3
Figure 3
BA metabolism is influenced between C57J and C57N mice depicted through comparative analysis of cecal meta-metabolome. Obesity influences a variety of metabolite classes in cecum of C57J and C57N mice including C24 BAs (a), tauro C24 BAs (b), other conjugated BAs (c), tauro C27 BAs (d), sulfates of C27 BAs (e), FAs (f), endocannabinoids (g), urobilinoids (h) and phenyl-containing metabolites (i). *Unknown metabolites.
Figure 4
Figure 4
Liver metabolome reveals opposite patterns of conjugated BAs, especially C24 and C27 TBAs. Metabolite classes affected between C57J and C57N mice including C24 BAs (a), C24 TBAs (b), other conjugated C24 BAs (c), C27 BAs (d), C27 TBAs (e), sulfates of C27 BAs (f), FAs (g) and urobilinoids (h). *Unknown metabolites.
Figure 5
Figure 5
Impaired alpha-oxidation in C57N mice. C57N mice showed increased levels of PA (a), but no changes of hydroxyPA (b) or pristanic acid (c) in liver samples. Increased levels of phytol (d) were detected in cecal samples of C57N mice with no changes of PA (e), hydroxyPA (f) but elevated levels of pristanic acid (g). P-value: *<0.05, **<0.01, ***<0.001 (Wilcoxon–Mann–Whitney test).
Figure 6
Figure 6
Mass difference network analysis and visualization—exploration of ‘Unknowns'. (a) Pie diagram illustrating the number of total mass signals detected in cecal meta-metabolome data set of (–) FT-ICR-MS (total=10 515 mass signals); consisting of 5434 mass signals that were assigned to molecular formulas with carbon, hydrogen, nitrogen, oxygen, sulfur and phosphorus (CHNOSP) composition, divided into Unknown mass signals (red) and known metabolites (black), which were annotated in MassTRIX. The gray part of the pie diagram consists of mass signals (5081) that were not assigned after NetCalc annotation. A mass difference network is illustrated in b generated from 5434 mass signals (nodes, black and red nodes) and 24 mass differences (edges) are colored in gray. Detailed inspection of the network in c; (d) A mass signal with molecular formula of C20H32O5, assigned as hydroxyl leukotriene B4, possessing edges to known and unknown mass signals.

References

    1. Antunes LCM, Han J, Ferreira RBR, Lolić P, Borchers CH, Finlay BB. Effect of antibiotic treatment on the intestinal metabolome. Antimicrob Agents Chemother. 2011;55:1494–1503. - PMC - PubMed
    1. Barker M, Rayens W. Partial least squares for discrimination. J Chemometrics. 2003;17:166–173.
    1. Baur P, Martin F-P, Gruber L, Bosco N, Brahmbhatt V, Collino S, et al. Metabolic phenotyping of the Crohn's disease-like IBD etiopathology in the TNFΔARE/WT mouse model. J Proteome Res. 2011;10:5523–5535. - PubMed
    1. Benjamini Y, Hochberg Y. Controlling the false discovery rate: a practical and powerful approach to multiple testing. J R Stat Soc B. 1995;289:300–1188.
    1. Booth AN, Masri MS, Robbins DJ, Emerson OH, Jones FT, DeEds F. Urinary phenolic acid metabolites of tyrosine. J Biol Chem. 1960;235:2649–2652.

Publication types

Substances