. 2015 Sep;220(5):2533-50.
doi: 10.1007/s00429-014-0804-y. Epub 2014 Jun 7.

Grey matter volumetric changes related to recovery from hand paresis after cortical sensorimotor stroke

Affiliations

Grey matter volumetric changes related to recovery from hand paresis after cortical sensorimotor stroke

E Abela et al. Brain Struct Funct. 2015 Sep.

Abstract

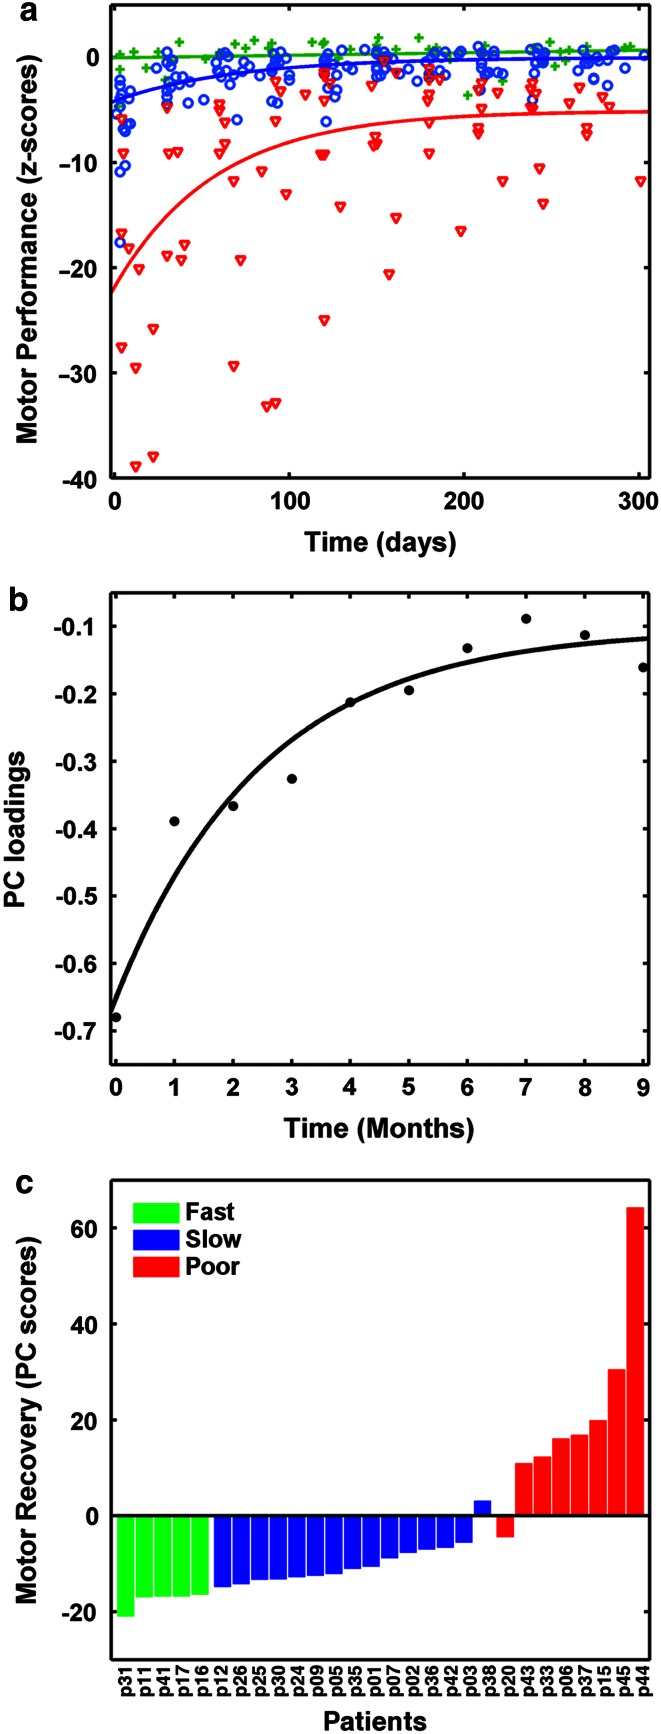
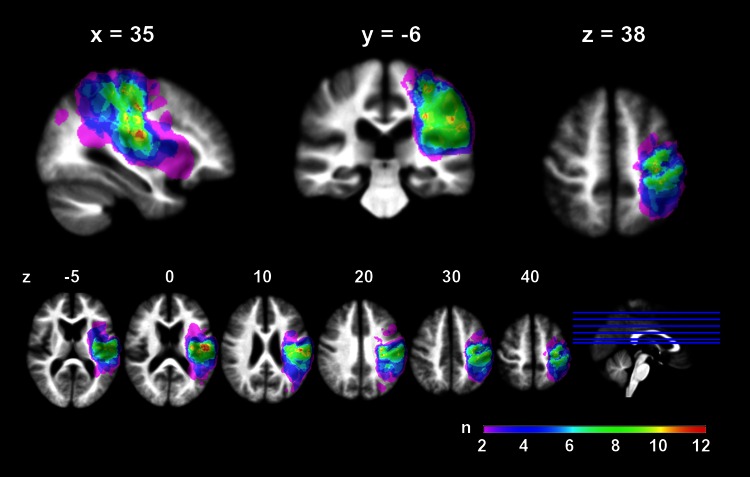
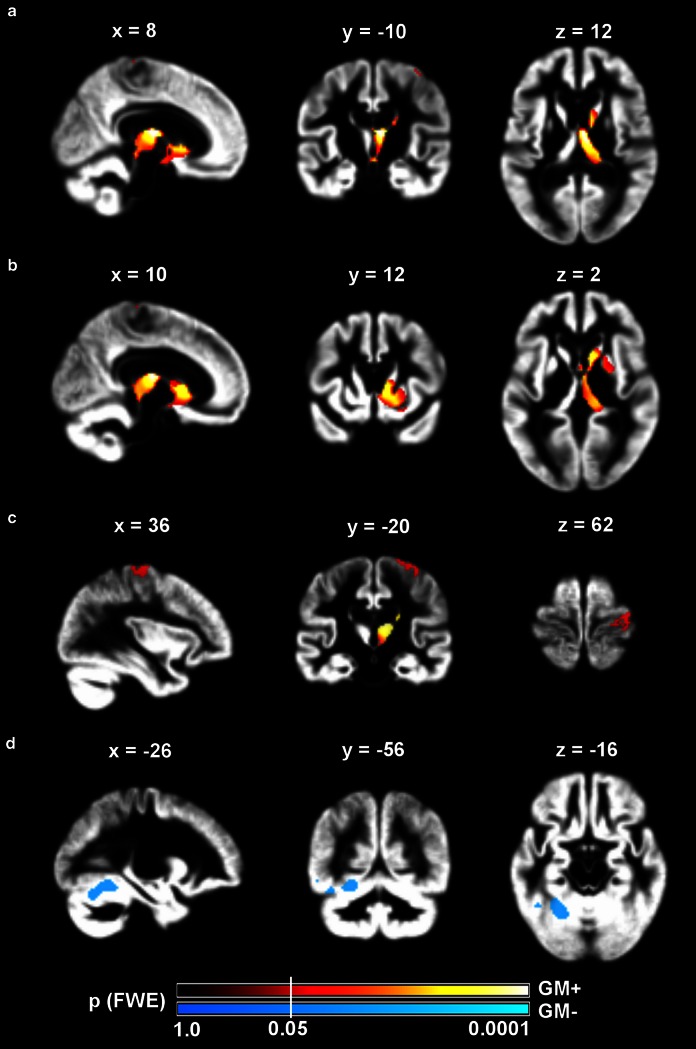
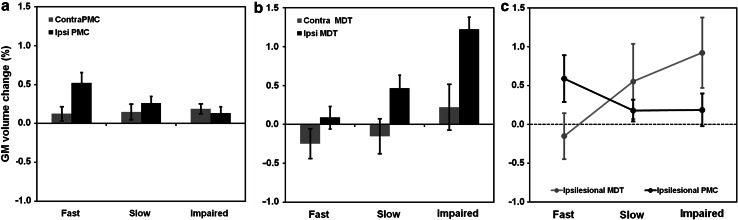
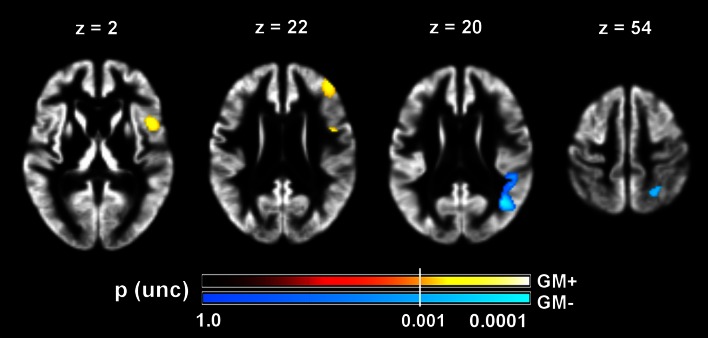
Preclinical studies using animal models have shown that grey matter plasticity in both perilesional and distant neural networks contributes to behavioural recovery of sensorimotor functions after ischaemic cortical stroke. Whether such morphological changes can be detected after human cortical stroke is not yet known, but this would be essential to better understand post-stroke brain architecture and its impact on recovery. Using serial behavioural and high-resolution magnetic resonance imaging (MRI) measurements, we tracked recovery of dexterous hand function in 28 patients with ischaemic stroke involving the primary sensorimotor cortices. We were able to classify three recovery subgroups (fast, slow, and poor) using response feature analysis of individual recovery curves. To detect areas with significant longitudinal grey matter volume (GMV) change, we performed tensor-based morphometry of MRI data acquired in the subacute phase, i.e. after the stage compromised by acute oedema and inflammation. We found significant GMV expansion in the perilesional premotor cortex, ipsilesional mediodorsal thalamus, and caudate nucleus, and GMV contraction in the contralesional cerebellum. According to an interaction model, patients with fast recovery had more perilesional than subcortical expansion, whereas the contrary was true for patients with impaired recovery. Also, there were significant voxel-wise correlations between motor performance and ipsilesional GMV contraction in the posterior parietal lobes and expansion in dorsolateral prefrontal cortex. In sum, perilesional GMV expansion is associated with successful recovery after cortical stroke, possibly reflecting the restructuring of local cortical networks. Distant changes within the prefrontal-striato-thalamic network are related to impaired recovery, probably indicating higher demands on cognitive control of motor behaviour.


Figures

Fig. 1
Fig. 1
Results of motor recovery analysis. a Summarizes the single-subject motor performance values on the “picking small objects” task (z-scores against time) and modelled average recovery trajectories of each patient subgroup (green crosses, fast recovery; blue circles, slow recovery; red triangles, impaired recovery). A z-score of zero indicates the mean of healthy control performance. b Depicts the loadings of the first principal component (PC), and their associated exponential fit. Loadings were calculated from PSO scores measured at each monthly visit (0, baseline; 9, final visit after 9 months). c Shows the single-subject PC scores. These values correspond to the projection of each subjects’ recovery trajectory on the first PC. Lower values indicate faster recovery, higher values increasing chronic deficit. Recovery subgroups cluster along a continuum of motor recovery, with some degree of overlap between slow and poor recovery subgroups. Patient identification number as in Table 1
Fig. 2
Fig. 2
Lesion distribution. A summary lesion map of all individual lesions rendered onto sagittal, coronal, and axial sections (upper row) and a series of axial slices (lower row) of an average anatomical image from all patients. Colour code indicates number (n) of patients with lesion at a given voxel. The colour scale for the lesion overlay map has an upper limit of 12, representing the greatest overlap among the patients in the precentral gyrus (slices z = 0–20). All images are in neurological convention (left side of the image is left side of the brain). Coordinates are in MNI space (mm)
Fig. 3
Fig. 3
Statistical parametric maps of grey matter volumetric change across all patients. Significant clusters of grey matter volume increase (GM+, hot colours) or decrease (GM−, cool colours) rendered on sagittal, coronal, and axial sections (from left to right) of an average grey matter segmentation. Sections are chosen to show the maximum effect on the ipsilesional mediodorsal thalamus (a), head of the caudate nucleus (b), precentral gyrus (c), and contralesional cerebellum (d). Colour map indicates family-wise error (FWE) corrected p values at every voxel. Statistical threshold was set at p(FWE) < .05 (white vertical line across colour bars). All images are in neurological convention (left side of the image is left side of the brain). Coordinates are in MNI space (mm)
Fig. 4
Fig. 4
Effect sizes of grey matter volumetric change across subgroups. Panel a and b show the average grey matter volume changes (% of total grey matter volume) in PMC and MDT. Panel c shows the effects of subgroup x locus interaction in the ipsilesional hemisphere. Cortical effects (premotor cortex, PMC) are more pronounced in fast recovered patients, whereas subcortical effects (MDT) are more pronounced in poorly recovered patients. Error bars represent 95 % confidence intervals
Fig. 5
Fig. 5
Statistical parametric maps of voxel-wise correlations between grey matter volumetric change and motor recovery. Motor recovery is linearly correlated with grey matter volume increase in the inferior frontal and dorsolateral prefrontal cortex (GM+, hot colours, left axial slices) and grey matter volume decrease in the inferior and superior parietal cortex (GM−, cool colours, right axial slices). Colour map indicates uncorrected (unc) p values at every voxel. Statistical threshold was set at p(unc) < .001 (white vertical line across colour bars). All images are in neurological convention (left side of the image is left side of the brain). Coordinates are in MNI space (mm)

References

    1. Abela E, Missimer J, Wiest R, Federspiel A, Hess C, Sturzenegger M, Weder B. Lesions to primary sensory and posterior parietal cortices impair recovery from hand paresis after stroke. PLoS One. 2012;7(2):e31275. doi: 10.1371/journal.pone.0031275. - DOI - PMC - PubMed
    1. Agosta F, Gorno-Tempini ML, Pagani E, Sala S, Caputo D, Perini M, Bartolomei I, Fruguglietti ME, Filippi M. Longitudinal assessment of grey matter contraction in amyotrophic lateral sclerosis: a tensor based morphometry study. Amyotroph Later Scler. 2009;10(3):168–174. doi: 10.1080/17482960802603841. - DOI - PubMed
    1. Alexander GE, DeLong MR, Strick PL. Parallel organization of functionally segregated circuits linking basal ganglia and cortex. Annu Rev Neurosci. 1986;9:357–381. doi: 10.1146/annurev.ne.09.030186.002041. - DOI - PubMed
    1. Amunts K, Lenzen M, Friederici AD, Schleicher A, Morosan P, Palomero-Gallagher N, Zilles K (2010) Broca’s region: novel organizational principles and multiple receptor mapping. PLoS Biol 8(9). doi:10.1371/journal.pbio.1000489 - PMC - PubMed
    1. Andersen SM, Rapcsak SZ, Beeson PM. Cost function masking during normalization of brains with focal lesions: still a necessity? NeuroImage. 2010;53(1):78–84. doi: 10.1016/j.neuroimage.2010.06.003. - DOI - PMC - PubMed

Publication types