. 2014 Jun 6;15(1):437.
doi: 10.1186/1471-2164-15-437.

Population-specific common SNPs reflect demographic histories and highlight regions of genomic plasticity with functional relevance

Affiliations

Population-specific common SNPs reflect demographic histories and highlight regions of genomic plasticity with functional relevance

Ananyo Choudhury et al. BMC Genomics. .

Abstract

Background: Population differentiation is the result of demographic and evolutionary forces. Whole genome datasets from the 1000 Genomes Project (October 2012) provide an unbiased view of genetic variation across populations from Europe, Asia, Africa and the Americas. Common population-specific SNPs (MAF > 0.05) reflect a deep history and may have important consequences for health and wellbeing. Their interpretation is contextualised by currently available genome data.

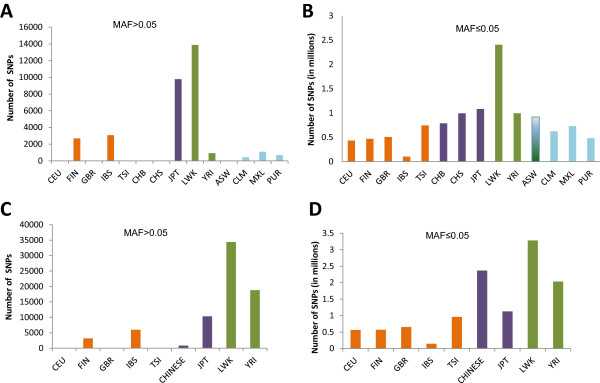
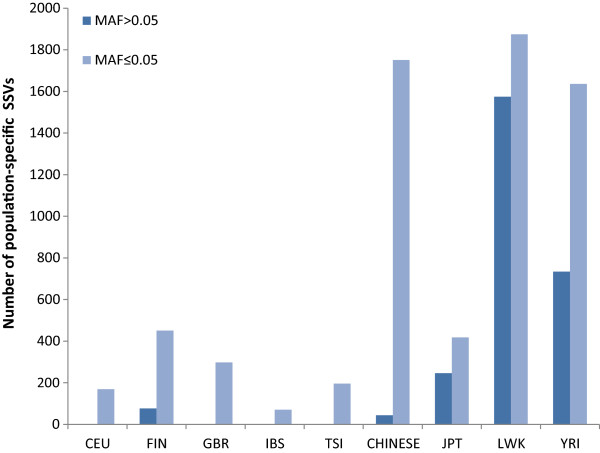
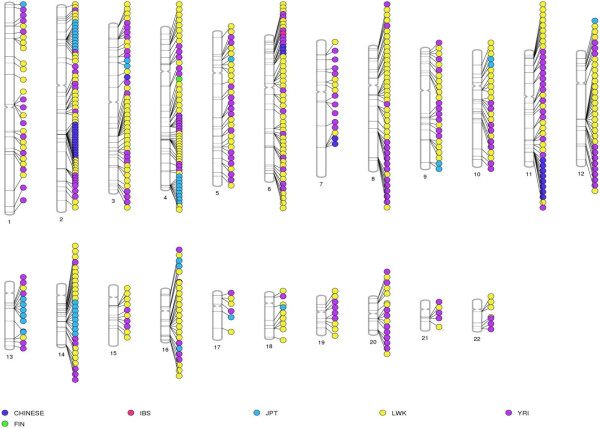
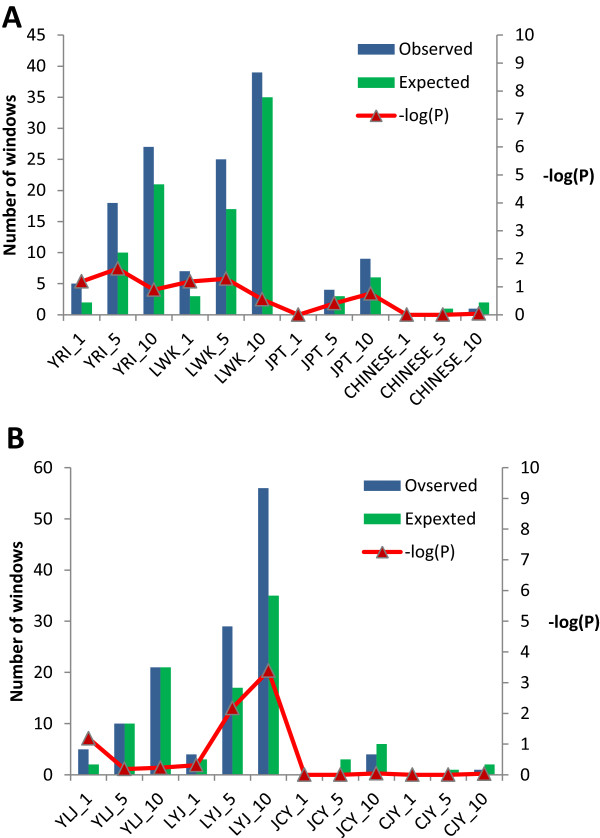
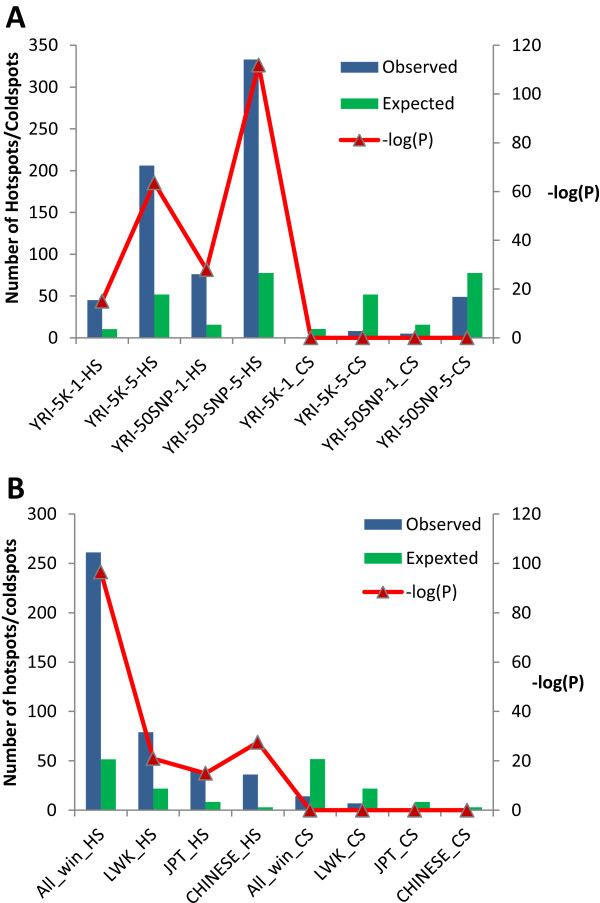
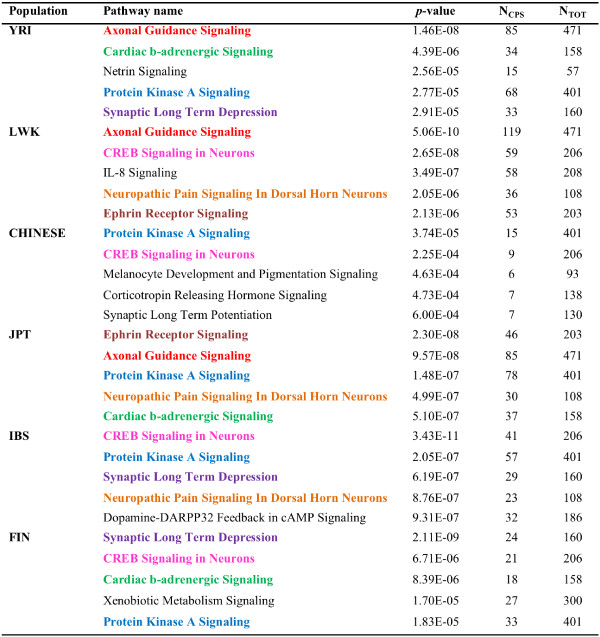
Results: The identification of common population-specific (CPS) variants (SNPs and SSV) is influenced by admixture and the sample size under investigation. Nine of the populations in the 1000 Genomes Project (2 African, 2 Asian (including a merged Chinese group) and 5 European) revealed that the African populations (LWK and YRI), followed by the Japanese (JPT) have the highest number of CPS SNPs, in concordance with their histories and given the populations studied. Using two methods, sliding 50-SNP and 5-kb windows, the CPS SNPs showed distinct clustering across large genome segments and little overlap of clusters between populations. iHS enrichment score and the population branch statistic (PBS) analyses suggest that selective sweeps are unlikely to account for the clustering and population specificity. Of interest is the association of clusters close to recombination hotspots. Functional analysis of genes associated with the CPS SNPs revealed over-representation of genes in pathways associated with neuronal development, including axonal guidance signalling and CREB signalling in neurones.

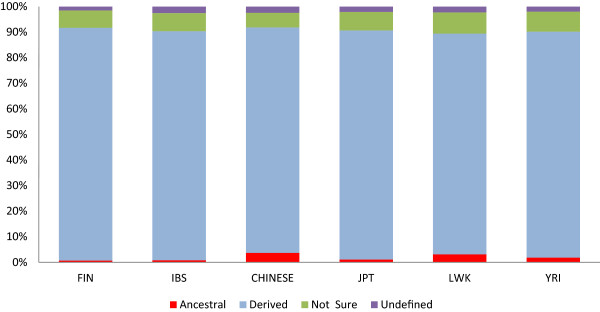
Conclusions: Common population-specific SNPs are non-randomly distributed throughout the genome and are significantly associated with recombination hotspots. Since the variant alleles of most CPS SNPs are the derived allele, they likely arose in the specific population after a split from a common ancestor. Their proximity to genes involved in specific pathways, including neuronal development, suggests evolutionary plasticity of selected genomic regions. Contrary to expectation, selective sweeps did not play a large role in the persistence of population-specific variation. This suggests a stochastic process towards population-specific variation which reflects demographic histories and may have some interesting implications for health and susceptibility to disease.


Figures

Figure 1
Figure 1
Population-specific SNPs in the 1000 genomes data. The number of population-specific SNPs for each of the 14 populations for common (A) and rare (B) SNPs are shown in (A) and (B). As the dataset includes admixed and related populations we removed the four known admixed populations (ASW, CLM, PUR, and MXL) and merged the two Chinese populations CHS and CHB into a single CHINESE population. The number of common (C) and rare (D) population-specific SNPs in the remaining 9 populations were retained for further analysis. The European populations are shown in orange, Asian populations in purple and the African populations in light green. The American and the admixed African populations are shown in blue.
Figure 2
Figure 2
Population-specific common (MAF > 0.05) and rare (MAF ≤ 0.05) short structural variants (SSVs).
Figure 3
Figure 3
Classification of population-specific SNP alleles into ancestral and derived. The SNPs for which no ancestral state information could be detected are shown as “Undefined” whereas the SNPs for which the ancestral state could not be detected with confidence are shown as “Not Sure”.
Figure 4
Figure 4
Genomic distribution of common population-specific (CPS) SNP-enriched 5-kb windows. The windows show very little overlap between populations and there are many blocks within populations containing contiguous windows of CPS SNP enrichment.
Figure 5
Figure 5
Analysis of potential signatures of selection in the common population-specific (CPS) SNP-enriched windows. (A) Expected and observed number of iES (iHS enrichment score) enriched windows (see Methods for details) in YRI, LWK, JPT and CHINESE populations. The number which has been appended to the population code indicates the top nth percentage of iHS score considered (1 = top 1%; 5 = top 5% and 10 = top 10%). The corresponding p-values for enrichment are shown on the right axis. (B) Expected and observed occurrences of top 1%, 5% and 10% population branch statistic (PBS) scores amongst CPS SNP-enriched windows for YRI, LWK, JPT and CHINESE populations. A three letter population combination code (say YLJ) has been used to describe the 3 population set used for calculating the PBS score. The first letter (Y) indicates the population being analysed (YRI in this case). The CPS SNP-enriched windows are analysed for this population. The second letter (L) indicates the population to which it was compared (LWK here) and the third letter (J) indicates the outlier (JPT in this case). The number, appended with an underscore to each three letter dataset name indicates the top nth percentage of PBS score cut-off used for analysis (1 = top 1%, 5 = top 5% and 10 = top 10%).
Figure 6
Figure 6
Recombination rates in common population-specific (CPS) SNP-enriched regions. A. The expected and observed number of hotspots (HS), defined on the basis of top 1% and 5% recombination rates) and coldspots (CS) (defined on the basis of lowest 1% and 5% recombination rates) in CPS SNP-enriched regions. (A) Recombination rates for the YRI was estimated on the basis of the HapMap24 YRI specific map downloaded using the UCSC table browser. The distribution of hotspots in regions detected by length based (5-kb) and window based (50-SNP) approaches using the top 1% (indicated with _1) and 5% (shown by _5) recombination rate is shown (B) The combined recombination map was used to identify whether the observed pattern of distribution of hotspots and cold spots in YRI also hold for JPT, LWK and CHINESE population specific windows (based on top 5% recombination rates). In addition to individual populations, the CPS SNP-enriched windows for all four populations taken together (ALL_HS and ALL_CS) are also shown.
Figure 7
Figure 7
Localization of common population-specific (CPS) SNPs in genomic regions defined on the basis of gene architecture. The majority of the CPS SNPs were found to be intergenic and intronic. The category ncRNA includes various types of non-coding RNAs and the category “other” includes upstream, downstream and UTR SNPs. The expected distribution based on overall occurrence of SNPs in human genome is shown as “Background”.
Figure 8
Figure 8
Ingenuity canonical pathways enriched with common population-specific (CPS) SNPs. The 5 most overrepresented pathways for each population identified using IPA are shown. NCPS denotes the number of CPS SNP containing genes in the pathway and NTOT denotes the total number of genes in the pathway. Each pathway which was found to occur in two or more populations is shown in bold and a distinct colour.

References

    1. Barbujani G, Colonna V. Human genome diversity: frequently asked questions. Trends Genet. 2010;26:285–295. doi: 10.1016/j.tig.2010.04.002. - DOI - PubMed
    1. Henn BM, Cavalli-Sforza LL, Feldman MW. The great human expansion. Proc Natl Acad Sci. 2012;109:17758–17764. doi: 10.1073/pnas.1212380109. - DOI - PMC - PubMed
    1. Balaresque PL, Ballereau SJ, Jobling MA. Challenges in human genetic diversity: demographic history and adaptation. Hum Mol Genet. 2007;16:R134–R139. doi: 10.1093/hmg/ddm242. - DOI - PubMed
    1. Scheinfeldt LB, Tishkoff SA. Recent human adaptation: genomic approaches, interpretation and insights. Nat Rev Genet. 2013;14:692–702. doi: 10.1038/nrg3604. - DOI - PMC - PubMed
    1. Hancock AM, Witonsky DB, Alkorta-Aranburu G, Beall CM, Gebremedhin A, Sukernik R, Utermann G, Pritchard JK, Coop G, Di Rienzo A. Adaptations to climate-mediated selective pressures in humans. PLoS Genet. 2010;7:e1001375. doi: 10.1371/journal.pgen.1001375. - DOI - PMC - PubMed

Publication types

LinkOut - more resources