Cardiac, skeletal, and smooth muscle mitochondrial respiration: are all mitochondria created equal?
- PMID: 24906913
- PMCID: PMC4121645
- DOI: 10.1152/ajpheart.00227.2014
Cardiac, skeletal, and smooth muscle mitochondrial respiration: are all mitochondria created equal?
Abstract
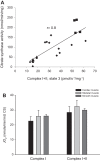
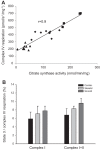
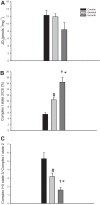
Unlike cardiac and skeletal muscle, little is known about vascular smooth muscle mitochondrial respiration. Therefore, the present study examined mitochondrial respiratory rates in smooth muscle of healthy human feed arteries and compared with that of healthy cardiac and skeletal muscles. Cardiac, skeletal, and smooth muscles were harvested from a total of 22 subjects (53 ± 6 yr), and mitochondrial respiration was assessed in permeabilized fibers. Complex I + II, state 3 respiration, an index of oxidative phosphorylation capacity, fell progressively from cardiac to skeletal to smooth muscles (54 ± 1, 39 ± 4, and 15 ± 1 pmol·s(-1)·mg(-1), P < 0.05, respectively). Citrate synthase (CS) activity, an index of mitochondrial density, also fell progressively from cardiac to skeletal to smooth muscles (222 ± 13, 115 ± 2, and 48 ± 2 μmol·g(-1)·min(-1), P < 0.05, respectively). Thus, when respiration rates were normalized by CS (respiration per mitochondrial content), oxidative phosphorylation capacity was no longer different between the three muscle types. Interestingly, complex I state 2 normalized for CS activity, an index of nonphosphorylating respiration per mitochondrial content, increased progressively from cardiac to skeletal to smooth muscles, such that the respiratory control ratio, state 3/state 2 respiration, fell progressively from cardiac to skeletal to smooth muscles (5.3 ± 0.7, 3.2 ± 0.4, and 1.6 ± 0.3 pmol·s(-1)·mg(-1), P < 0.05, respectively). Thus, although oxidative phosphorylation capacity per mitochondrial content in cardiac, skeletal, and smooth muscles suggest all mitochondria are created equal, the contrasting respiratory control ratio and nonphosphorylating respiration highlight the existence of intrinsic functional differences between these muscle mitochondria. This likely influences the efficiency of oxidative phosphorylation and could potentially alter ROS production.
Keywords: feed arteries; oxidative phosphorylation capacity; respiratory control ratio.
Figures


References
-
- Balaban RS, Nemoto S, Finkel T. Mitochondria, oxidants, and aging. Cell 120: 483–495, 2005 - PubMed
-
- Boudina S, Sena S, O'Neill BT, Tathireddy P, Young ME, Abel ED. Reduced mitochondrial oxidative capacity and increased mitochondrial uncoupling impair myocardial energetics in obesity. Circulation 112: 2686–2695, 2005 - PubMed
Publication types
MeSH terms
Substances
Grants and funding
LinkOut - more resources
Full Text Sources
Other Literature Sources
Miscellaneous

