

An optimized method for estimating the tidal volume from intracardiac or body surface electrocardiographic signals: implications for estimating minute ventilation
- PMID: 24906917
- PMCID: PMC4121652
- DOI: 10.1152/ajpheart.00038.2014
An optimized method for estimating the tidal volume from intracardiac or body surface electrocardiographic signals: implications for estimating minute ventilation
Abstract
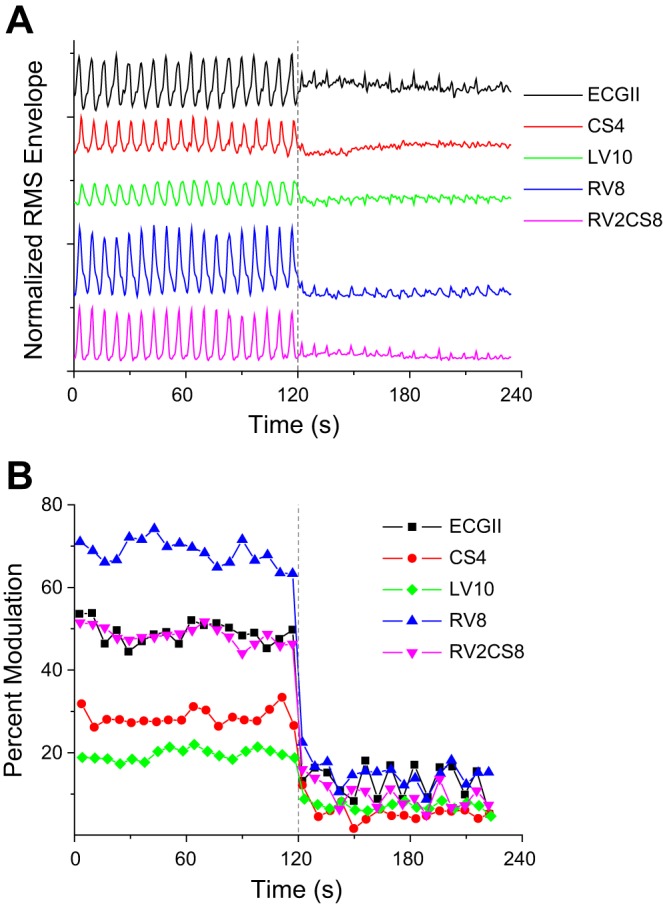
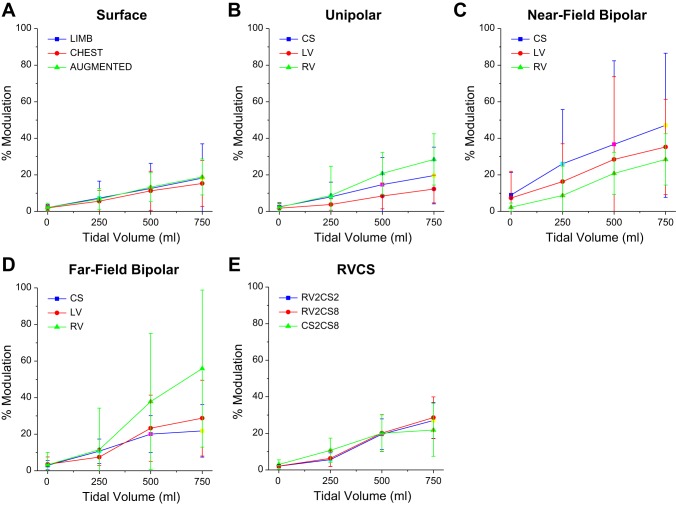
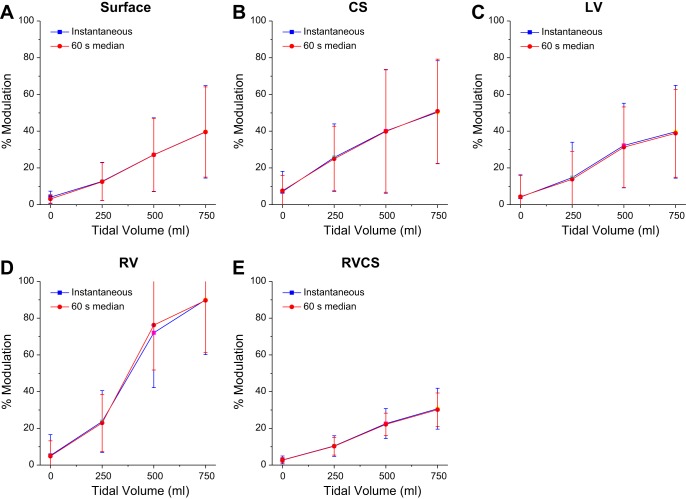
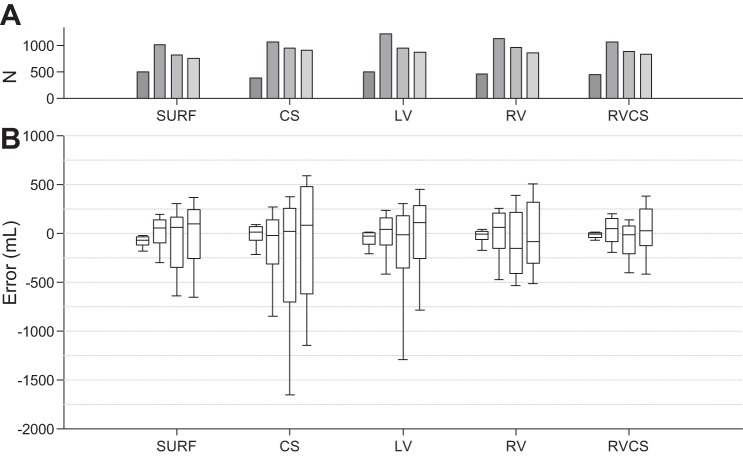
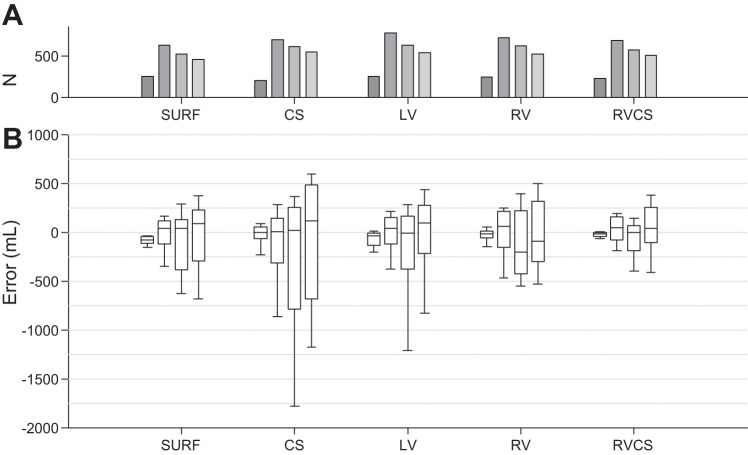
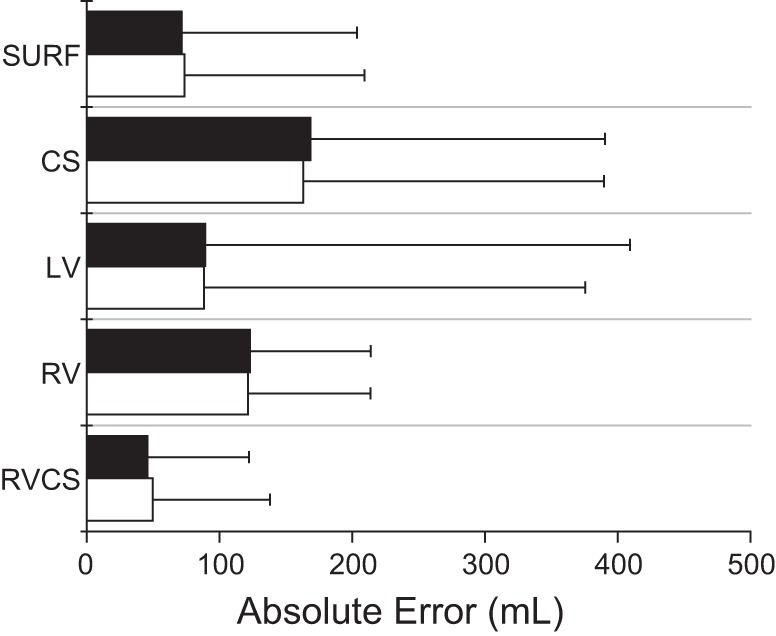
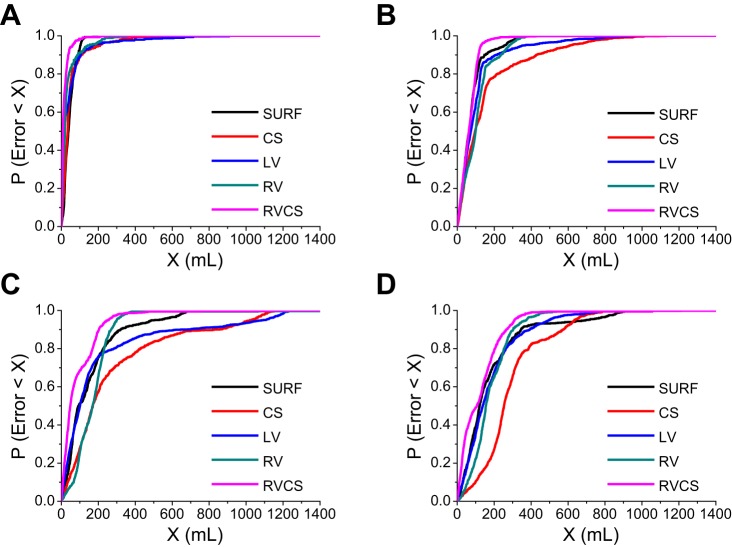
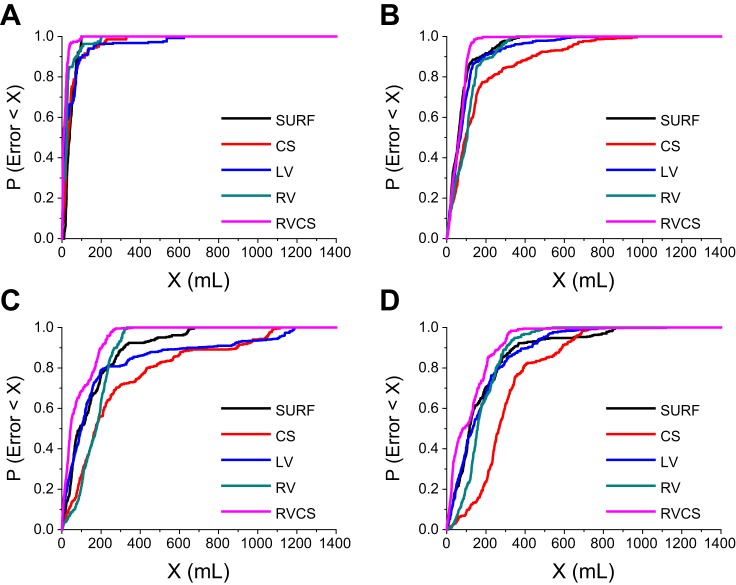
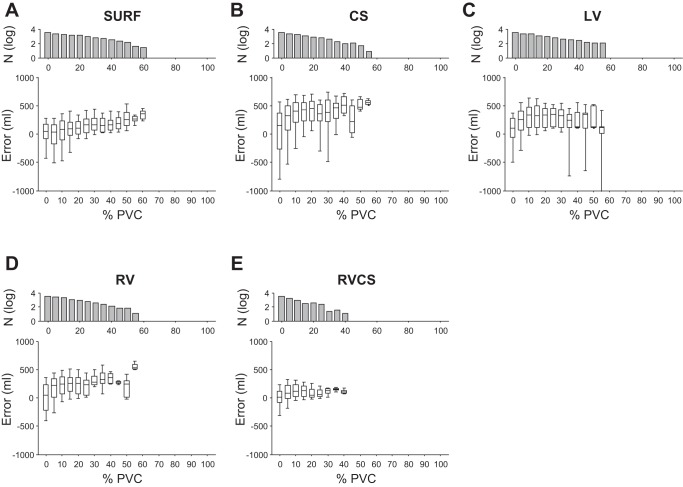
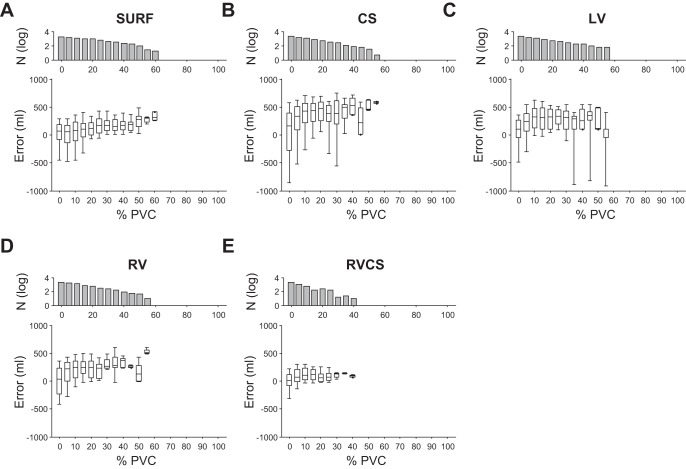
The ability to accurately monitor tidal volume (TV) from electrocardiographic (ECG) signals holds significant promise for improving diagnosis treatment across a variety of clinical settings. The objective of this study was to develop a novel method for estimating the TV from ECG signals. In 10 mechanically ventilated swine, we collected intracardiac electrograms from catheters in the coronary sinus (CS), left ventricle (LV), and right ventricle (RV), as well as body surface electrograms, while TV was varied between 0 and 750 ml at respiratory rates of 7-14 breaths/min. We devised an algorithm to determine the optimized respirophasic modulation of the amplitude of the ECG-derived respiratory signal. Instantaneous measurement of respiratory modulation showed an absolute error of 72.55, 147.46, 85.68, 116.62, and 50.89 ml for body surface, CS, LV, RV, and RV-CS leads, respectively. Minute TV estimation demonstrated a more accurate estimation with an absolute error of 69.56, 153.39, 79.33, 122.16, and 48.41 ml for body surface, CS, LV, RV, and RV-CS leads, respectively. The RV-CS and body surface leads provided the most accurate estimations that were within 7 and 10% of the true TV, respectively. Finally, the absolute error of the bipolar RV-CS lead was significantly lower than any other lead configuration (P < 0.0001). In conclusion, we have demonstrated that ECG-derived respiratory modulation provides an accurate estimation of the TV using intracardiac or body surface signals, without the need for additional hardware.
Keywords: body surface; intracardiac electrograms; minute ventilation; percent modulation; tidal volume.
Copyright © 2014 the American Physiological Society.
Figures
Similar articles
-
Utility of a smartphone based system (cvrphone) to accurately determine apneic events from electrocardiographic signals.PLoS One. 2019 Jun 17;14(6):e0217217. doi: 10.1371/journal.pone.0217217. eCollection 2019. PLoS One. 2019. PMID: 31206522 Free PMC article.
-
An optimized method for the estimation of the respiratory rate from electrocardiographic signals: implications for estimating minute ventilation.Am J Physiol Heart Circ Physiol. 2014 Aug 1;307(3):H437-47. doi: 10.1152/ajpheart.00039.2014. Epub 2014 May 23. Am J Physiol Heart Circ Physiol. 2014. PMID: 24858847 Free PMC article.
-
A novel method to capture the onset of dynamic electrocardiographic ischemic changes and its implications to arrhythmia susceptibility.J Am Heart Assoc. 2014 Sep 3;3(5):e001055. doi: 10.1161/JAHA.114.001055. J Am Heart Assoc. 2014. PMID: 25187521 Free PMC article.
-
Usefulness of the 12-lead electrocardiogram in the follow-up of patients with cardiac resynchronization devices. Part I.Cardiol J. 2011;18(5):476-86. doi: 10.5603/cj.2011.0002. Cardiol J. 2011. PMID: 21947982 Review.
-
Development of three methods for extracting respiration from the surface ECG: a review.J Electrocardiol. 2014 Nov-Dec;47(6):819-25. doi: 10.1016/j.jelectrocard.2014.07.020. Epub 2014 Aug 4. J Electrocardiol. 2014. PMID: 25194875 Review.
Cited by
-
Development and validation of models to predict personal ventilation rate for air pollution research.J Expo Sci Environ Epidemiol. 2019 Jun;29(4):568-577. doi: 10.1038/s41370-018-0067-4. Epub 2018 Sep 5. J Expo Sci Environ Epidemiol. 2019. PMID: 30185945 Free PMC article.
-
Utility of a smartphone based system (cvrphone) to accurately determine apneic events from electrocardiographic signals.PLoS One. 2019 Jun 17;14(6):e0217217. doi: 10.1371/journal.pone.0217217. eCollection 2019. PLoS One. 2019. PMID: 31206522 Free PMC article.
-
Design Implementation and Evaluation of a Mobile Continuous Blood Oxygen Saturation Monitoring System.Sensors (Basel). 2020 Nov 18;20(22):6581. doi: 10.3390/s20226581. Sensors (Basel). 2020. PMID: 33217945 Free PMC article.
-
Tidal volume estimation using the blanket fractal dimension of the tracheal sounds acquired by smartphone.Sensors (Basel). 2015 Apr 27;15(5):9773-90. doi: 10.3390/s150509773. Sensors (Basel). 2015. PMID: 25923929 Free PMC article.
-
Tracking Tidal Volume From Holter and Wearable Armband Electrocardiogram Monitoring.IEEE J Biomed Health Inform. 2024 Jun;28(6):3457-3465. doi: 10.1109/JBHI.2024.3383232. Epub 2024 Jun 6. IEEE J Biomed Health Inform. 2024. PMID: 38557616 Free PMC article.
References
-
- Abrahams N, Fisk GC, Churches AE, Loughman J, Vonwiller JB, Agzarian J, Harrison GA. Errors in pneumotachography with intermittent positive pressure ventilation. Anaesth Intensive Care 3: 284–294, 1975 - PubMed
-
- Anderson DE, Coyle K, Haythornthwaite JA. Ambulatory monitoring of respiration: inhibitory breathing in the natural environment. Psychophysiology 29: 551–557, 1992 - PubMed
-
- Armoundas AA, Weiss EH, Sayadi O, Laferriere S, Sajja N, Mela T, Singh JP, Barrett CD, Heist KE, Merchant FM. A novel pacing method to suppress repolarization alternans in vivo: implications for arrhythmia prevention. Heart Rhythm 10: 564–572, 2013 - PubMed
-
- Bonavia M, Averame G, Canonica W, Cricelli C, Fogliani V, Grassi C, Moretti AM, Ferri P, Rossi A, Paggiaro PL. Feasibility and validation of telespirometry in general practice: The Italian “Alliance” study. Respir Med 103: 1732–1737, 2009 - PubMed
-
- Brack T, Jubran A, Tobin MJ. Dyspnea and decreased variability of breathing in patients with restrictive lung disease. Am J Respir Crit Care Med 165: 1260–1264, 2002 - PubMed
Publication types
MeSH terms
Grants and funding
LinkOut - more resources
Full Text Sources
Other Literature Sources