. 2014 Aug 1;289(31):21312-24.
doi: 10.1074/jbc.M114.564625. Epub 2014 Jun 6.

Characterization of genomic deletion efficiency mediated by clustered regularly interspaced short palindromic repeats (CRISPR)/Cas9 nuclease system in mammalian cells

Affiliations

Characterization of genomic deletion efficiency mediated by clustered regularly interspaced short palindromic repeats (CRISPR)/Cas9 nuclease system in mammalian cells

Matthew C Canver et al. J Biol Chem. .

Erratum in

Abstract

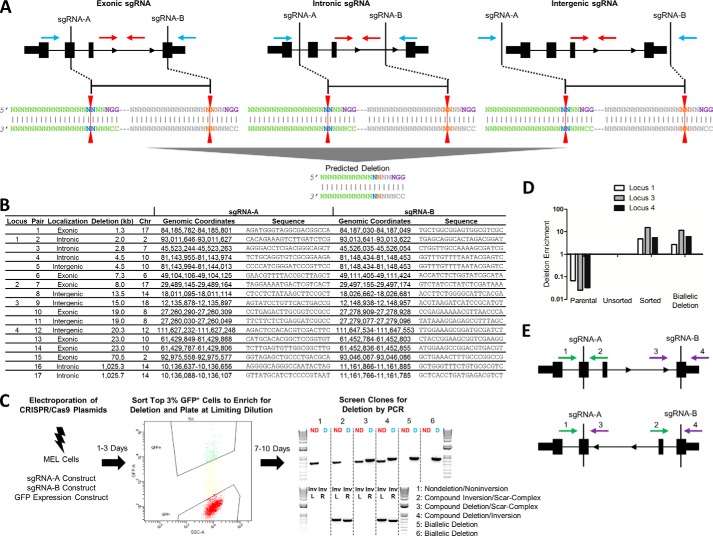
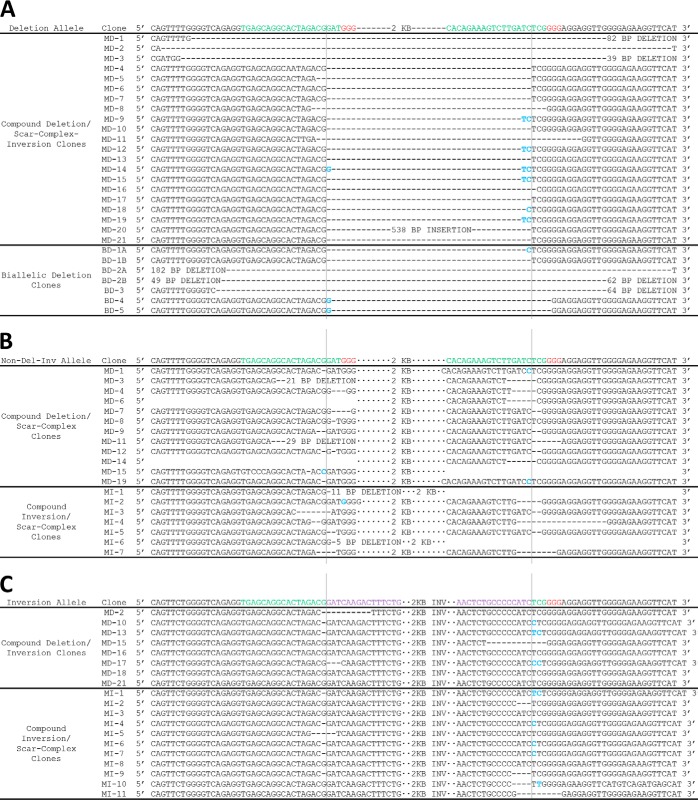
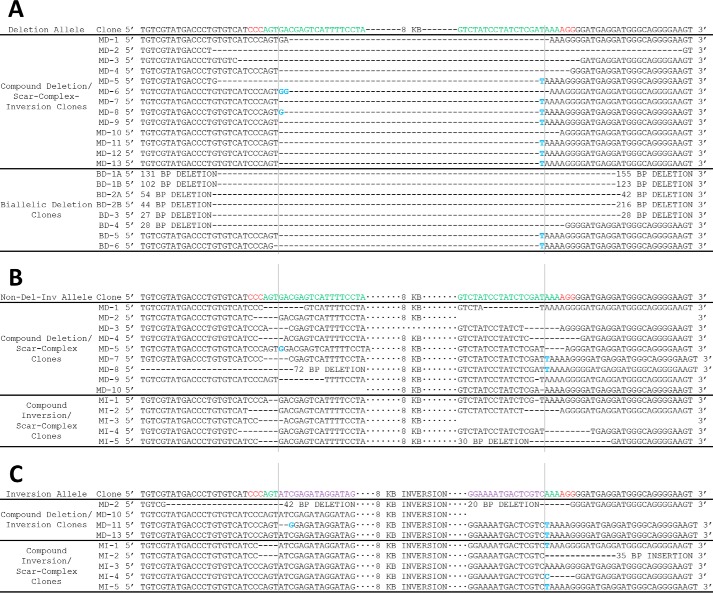
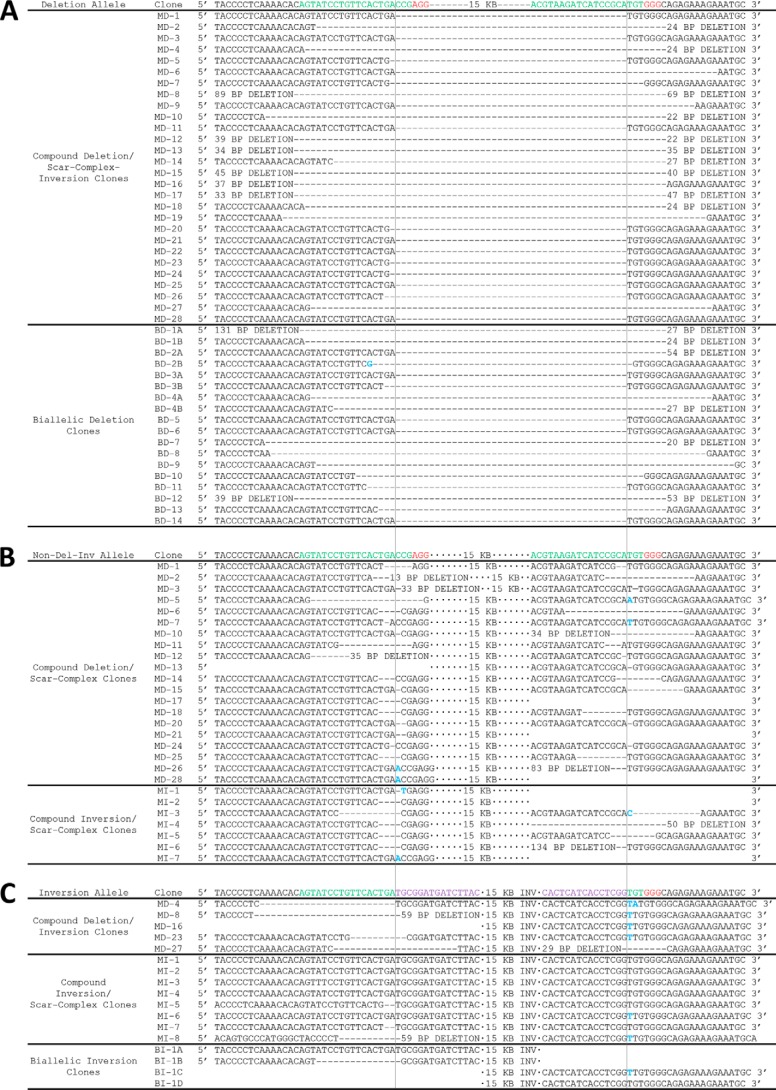
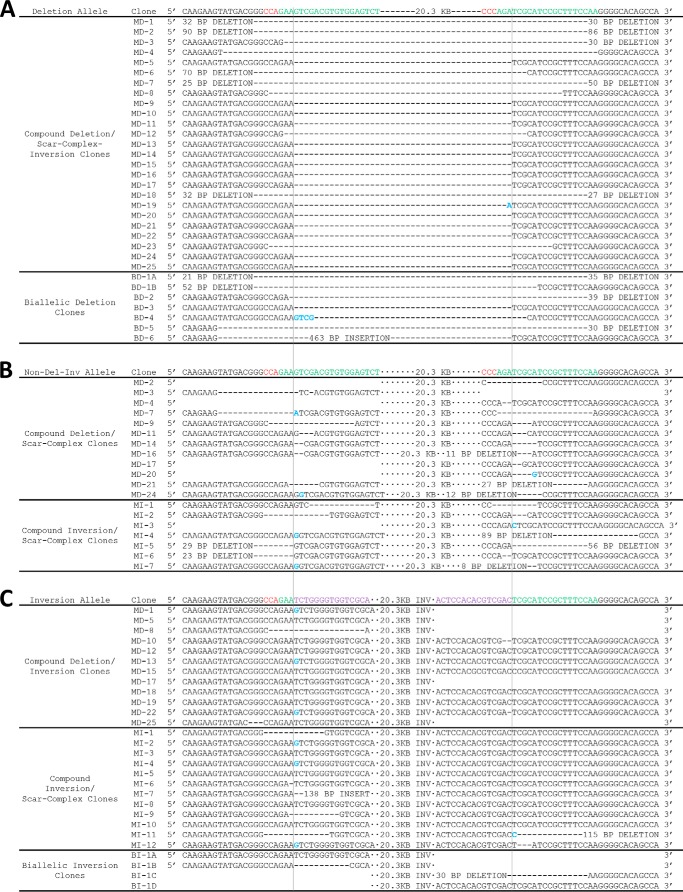
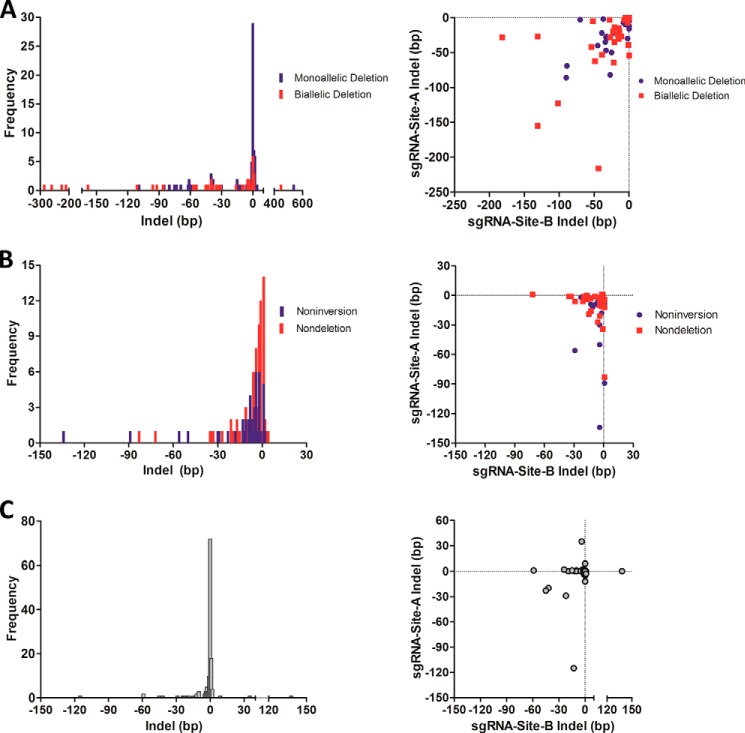
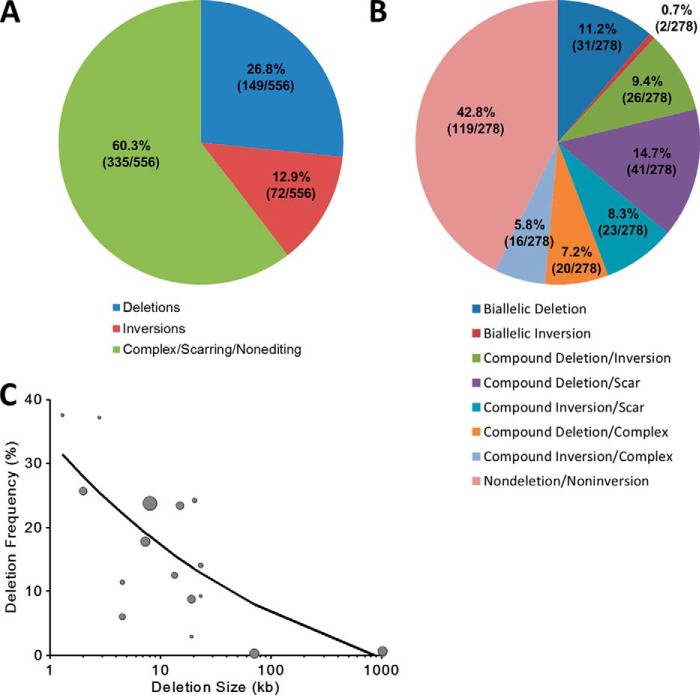
The clustered regularly interspaced short [corrected] palindromic repeats (CRISPR)/CRISPR-associated (Cas) 9 nuclease system has provided a powerful tool for genome engineering. Double strand breaks may trigger nonhomologous end joining repair, leading to frameshift mutations, or homology-directed repair using an extrachromosomal template. Alternatively, genomic deletions may be produced by a pair of double strand breaks. The efficiency of CRISPR/Cas9-mediated genomic deletions has not been systematically explored. Here, we present a methodology for the production of deletions in mammalian cells, ranging from 1.3 kb to greater than 1 Mb. We observed a high frequency of intended genomic deletions. Nondeleted alleles are nonetheless often edited with inversions or small insertion/deletions produced at CRISPR recognition sites. Deleted alleles also typically include small insertion/deletions at predicted deletion junctions. We retrieved cells with biallelic deletion at a frequency exceeding that of probabilistic expectation. We demonstrate an inverse relationship between deletion frequency and deletion size. This work suggests that CRISPR/Cas9 is a robust system to produce a spectrum of genomic deletions to allow investigation of genes and genetic elements.

Keywords: CRISPR; Cas9; Gene Expression; Gene Knock-out; Gene Regulation; Genetics; Genome Engineering; Genomic Deletion; Genomics.


Figures

FIGURE 1.
FIGURE 1.
Schema for CRISPR/Cas9-mediated genomic deletion. A, exonic, intronic, and intergenic sgRNA deletion strategies. The sgRNA sites are shown in relation to an idealized gene. The PAM sequence (purple) is shown on the top strand for simplicity, but PAMs on both the top (Watson) and bottom (Crick) strands were used in different combinations. The red line indicates the predicted Cas9 cleavage between positions 17 and 18. The blue arrows indicate the position of PCR primers for deletion band amplification, and the red arrows indicate the position of PCR primers for nondeletion band amplification. B, sgRNA localization (exonic/intronic/intergenic), deletion size, chromosome, genomic coordinates (mm10), and sequence for each sgRNA pair. Loci 1–4 used for further sequence analysis are indicated. C, CRISPR/Cas9-mediated genomic deletion strategy for MEL cells. 2 × 10⁶ cells were electroporated with 5 μg of each sgRNA construct and 0.5 μg of a GFP expression construct. The top 3% of GFP+ cells were sorted 1–3 days post-electroporation and plated at limiting dilution. 7–10 days after plating, gDNA was extracted, and clones were screened for deletion by PCR. A representative screening agarose gel shows the detection of two nondeletion clones, two monoallelic deletion clones, and two biallelic deletion clones. The red ND refers to the nondeletion amplicon as schematized in A, and the blue D refers to the deletion amplicon as schematized in A. Upon inversion analysis, clones were further classified as nondeletion/noninversion, compound inversion/scar-complex, compound deletion/scar-complex, and compound deletion/inversion. The distinction between scar and complex was established by the presence or absence of PCR amplification flanking both sgRNA target recognition sites. Inv refers to inversion amplicons flanking left and right sgRNA recognition sites (L and R, respectively). D, gDNA was extracted from cells prior to (unsorted) and after sorting the top 3% of GFP+ cells (sorted). Deletion enrichment was calculated by RT-quantitative PCR, and data were normalized to the unsorted cells using the 2−ΔΔCt method. A biallelic deletion clone for each locus was used as a positive control and nonedited parental gDNA as a negative control. E, primers flanking the sgRNA recognition sites (shown in green and purple) were used to amplify 500–700-bp regions around each sgRNA site on nondeletion/noninversion alleles (primers 1/2 and 3/4, top panel). Inversion PCR utilized primer pairs (primers 1/3 and 2/4, respectively; bottom panel) in which both primers were in the same orientation, one inside and one outside the intended deletion.
FIGURE 2.
FIGURE 2.
Indels at the nondeletion/noninversion allele and indels at the predicted deletion/inversion junction at locus 1. A, sequencing of the deletion allele in compound deletion/scar-complex-inversion clones and biallelic deletion clones at locus 1 (intended 2.0-kb deletion). Top row indicates sequence of unmodified allele. sgRNA sequences are shown in green and PAM sequences in red. Deletion events are shown by an equivalent number of dash marks and insertions are highlighted in blue. Vertical lines indicate predicted cleavage site, between positions 17 and 18 of the sgRNA. B, sequencing of the nondeletion/noninversion allele in compound deletion/scar-complex clones and compound inversion/scar-complex clones. Top row indicates sequence of the unmodified allele. sgRNA sequences are shown in green and PAM sequences in red. Deletion events are shown by an equivalent number of dash marks and insertions are highlighted in blue. Vertical lines indicate predicted cleavage site, between positions 17 and 18 of the sgRNA. C, sequencing of the inversion allele in compound deletion/inversion clones and compound inversion/scar-complex clones. Top row indicates perfect inversion of intervening segment between predicted cleavage sites. sgRNA sequences are shown in green, PAM sequences in red, and inverted sequence in purple. Deletion events are shown by an equivalent number of dash marks and insertions are highlighted in blue. Vertical lines indicate predicted cleavage site, between positions 17 and 18 of the sgRNA. MD indicates monoallelic deletion; MI indicates monoallelic inversion, and BD indicates biallelic deletion.
FIGURE 3.
FIGURE 3.
Indels at the nondeletion/noninversion allele and indels at the predicted deletion/inversion junction at locus 2. A, sequencing of the deletion allele in compound deletion/scar-complex-inversion clones and biallelic deletion clones at locus 2 (intended 8.0-kb deletion). Top row indicates sequence of unmodified allele. sgRNA sequences are shown in green and PAM sequences in red. Deletion events are shown by an equivalent number of dash marks, and insertions are highlighted in blue. Vertical lines indicate predicted cleavage site, between positions 17 and 18 of the sgRNA. B, sequencing of the nondeletion/noninversion allele in compound deletion/scar-complex clones and compound inversion/scar-complex clones. Top row indicates sequence of unmodified allele. sgRNA sequences are shown in green and PAM sequences in red. Deletion events are shown by an equivalent number of dash marks and insertions are highlighted in blue. Vertical lines indicate predicted cleavage site, between positions 17 and 18 of the sgRNA. C, sequencing of the inversion allele in compound deletion/inversion clones and compound inversion/scar-complex clones. Top row indicates perfect inversion of intervening segment between predicted cleavage sites. sgRNA sequences are shown in green, PAM sequences in red, and inverted sequence in purple. Deletion events are shown by an equivalent number of dash marks, and insertions are highlighted in blue. Vertical lines indicate predicted cleavage site, between positions 17 and 18 of the sgRNA. MD indicates monoallelic deletion; MI indicates monoallelic inversion, and BD indicates biallelic deletion. Clone MD10 exhibited amplification using PCR primers flanking sgRNA-site-B (see Fig. 1E, top panel) and amplification using inversion PCR primers flanking sgRNA-site-A (see Fig. 1E, bottom panel), suggesting a complex inversion. Clone MD2 exhibited amplification using PCR primers flanking sgRNA-site-A (see Fig. 1E, top panel) and amplification using inversion PCR primers flanking both sgRNA-site-A and sgRNA-site-B (see Fig. 1E, bottom panel), suggesting at least three alleles at the tested locus, which could be consistent with rare tetraploidies observed in MEL cells by karyotype (data not shown) or with a mixed clone. This was the only clone out of the 278 clones examined in detail across the four loci to exhibit apparent allele number greater than 2.
FIGURE 4.
FIGURE 4.
Indels at the nondeletion/noninversion allele and indels at the predicted deletion/inversion junction at locus 3. A, sequencing of the deletion allele in compound deletion/scar-complex-inversion clones and biallelic deletion clones at locus 3 (intended 15.0-kb deletion). Top row indicates sequence of unmodified allele. sgRNA sequences are shown in green and PAM sequences in red. Deletion events are shown by an equivalent number of dash marks and insertions are highlighted in blue. Vertical lines indicate predicted cleavage site, between positions 17 and 18 of the sgRNA. B, sequencing of the nondeletion/noninversion allele in compound deletion/scar-complex clones and compound inversion/scar-complex clones. Top row indicates sequence of unmodified allele. sgRNA sequences are shown in green and PAM sequences in red. Deletion events are shown by an equivalent number of dash marks and insertions are highlighted in blue. Vertical lines indicate predicted cleavage site, between positions 17 and 18 of the sgRNA. C, sequencing of the inversion allele in compound deletion/inversion clones, compound inversion/scar-complex clones, and biallelic inversion clones. Top row indicates perfect inversion of the intervening segment between predicted cleavage sites. sgRNA sequences are shown in green, PAM sequences in red, and inverted sequence in purple. Deletion events are shown by an equivalent number of dash marks and insertions are highlighted in blue. Vertical lines indicate predicted cleavage site, between positions 17 and 18 of the sgRNA. MD indicates monoallelic deletion; MI indicates monoallelic inversion; BD indicates biallelic deletion, and BI indicates biallelic inversion. Biallelic inversion alleles are labeled A–D (rather than merely A and B) because phase of inversion junctions within a clone was not resolved. Clone MD16 did not exhibit amplification using PCR primers flanking either sgRNA-site-A or sgRNA-site-B (see Fig. 1E, top panel) but did exhibit amplification using inversion PCR primers flanking sgRNA-site-B only (see Fig. 1E, bottom panel), suggesting a complex inversion.
FIGURE 5.
FIGURE 5.
Indels at the nondeletion/noninversion allele and indels at the predicted deletion/inversion junction at locus 4. A, sequencing of the deletion allele in compound deletion/scar-complex-inversion clones and biallelic deletion clones at locus 4 (intended 20.3-kb deletion). Top row indicates sequence of unmodified allele. sgRNA sequences are shown in green and PAM sequences in red. Deletion events are shown by an equivalent number of dash marks, and insertions are highlighted in blue. Vertical lines indicate predicted cleavage site, between positions 17 and 18 of the sgRNA. B, sequencing of the nondeletion/noninversion allele in compound deletion/scar-complex clones and compound inversion/scar-complex clones. Top row indicates sequence of unmodified allele. sgRNA sequences are shown in green and PAM sequences in red. Deletion events are shown by an equivalent number of dash marks and insertions are highlighted in blue. Vertical lines indicate predicted cleavage site, between positions 17 and 18 of the sgRNA. C, sequencing of the inversion allele in compound deletion/inversion clones, compound inversion/scar-complex clones, and biallelic inversion. Top row indicates perfect inversion of intervening segment between predicted cleavage sites. sgRNA sequences are shown in green, PAM sequences in red, and inverted sequence in purple. Deletion events are shown by an equivalent number of dash marks and insertions are highlighted in blue. Vertical lines indicate predicted cleavage site, between positions 17 and 18 of the sgRNA. MD indicates monoallelic deletion; MI indicates monoallelic inversion; BD indicates biallelic deletion, and BI indicates biallelic inversion. Biallelic inversion alleles are labeled A–D (rather than merely A and B) because phase of inversion junctions within a clone was not resolved. Clones MD1, MD5, MD8, and MD25 did not exhibit amplification using PCR primers flanking either sgRNA-site-A or sgRNA-site-B (see Fig. 1E, top panel) but did exhibit amplification using inversion PCR primers flanking sgRNA-site-A only (see Fig. 1E, bottom panel), suggesting complex inversions. Clone MD17 exhibited amplification using PCR primers flanking sgRNA-site-B (see Fig. 1E, top panel) and amplification using inversion PCR primers flanking sgRNA-site-A (see Fig. 1E, bottom panel), suggesting a complex inversion.
FIGURE 6.
FIGURE 6.
Indels at deleted, scarred, and inverted alleles. A, left panel, frequency distribution of indel formation at the predicted deletion junctions from the deleted alleles of monoallelic and biallelic deletion clones across four loci examined in detail. Indels ranged from −176 to +538 bp in monoallelic deletion clones and from −286 to +449 bp in biallelic deletion clones with the majority found at −10 to 0 bp. A, right panel, distribution of negative indels on the deletion allele produced by sgRNA-A and sgRNA-B from both monoallelic and biallelic deletion clones. Positive indels could not be reliably mapped to individual sites, so were excluded from analysis. B, left panel, frequency distribution of indel formation (scarring) on the nondeleted allele from compound deletion/scar-complex clones and on the noninverted allele from compound inversion/scar-complex clones across eight sgRNA sites from four loci examined in detail. Indels ranged from −83 to +1 bp for the nondeletion alleles and from −134 to +2 bp for the noninversion alleles. B, right panel, distribution of indels on the nondeleted allele in compound deletion/scar clones and the noninverted allele in compound inversion/scar clones in which sequences surrounding both sgRNA-A and sgRNA-B sites were amplified. C, left panel, frequency distribution of indel formation at the predicted inversion junctions from the inversion alleles of compound inversion/scar-complex-deletion clones across all four loci examined in detail. Indels ranged from −115 to +138 bp with the majority found at −10 to 0 bp. C, right panel, distribution of indels on the inverted allele produced by sgRNA-A and sgRNA-B from compound inversion/scar-complex-deletion clones.
FIGURE 7.
FIGURE 7.
Deletion/inversion frequency and characterization of outcomes when using two sgRNAs. A, deletion and inversion frequency were calculated on a per allele basis for all 278 clones (556 alleles) across the four loci examined in detail. B, 278 clones from across the four loci examined in detail were classified into eight categories based on the presence of deletion, inversion, scar, and complex alleles. C, deletion frequency inversely related to deletion size. Genomic deletion sizes ranged from 1.3 to 1,026 kb, which demonstrate a decrease in the frequency of deletion events as deletion size increases. The size of the circles corresponds to the number of clones screened for the corresponding sgRNA pair. The best fit relationship was determined by a weighted (by number of clones screened) nonlinear regression of the form function(deletion size) = k1 + k2(deletion size in kb)k3, where k1, k2, and k3 represent constants: function(deletion size in kb) = −2.84 + 41.41(deletion size in kb)−0.36; R2 = 0.62. The weighted nonlinear regression was computed using the fitnlm function available in MATLAB R2013b software (MathWorks, Natick, MA).

References

    1. Barrangou R., Fremaux C., Deveau H., Richards M., Boyaval P., Moineau S., Romero D. A., Horvath P. (2007) CRISPR provides acquired resistance against viruses in prokaryotes. Science 315, 1709–1712 - PubMed
    1. Cong L., Ran F. A., Cox D., Lin S., Barretto R., Habib N., Hsu P. D., Wu X., Jiang W., Marraffini L. A., Zhang F. (2013) Multiplex genome engineering using CRISPR/Cas systems. Science 339, 819–823 - PMC - PubMed
    1. Mali P., Yang L., Esvelt K. M., Aach J., Guell M., DiCarlo J. E., Norville J. E., Church G. M. (2013) RNA-guided human genome engineering via Cas9. Science 339, 823–826 - PMC - PubMed
    1. Jinek M., Chylinski K., Fonfara I., Hauer M., Doudna J. A., Charpentier E. (2012) A programmable dual-RNA-guided DNA endonuclease in adaptive bacterial immunity. Science 337, 816–821 - PMC - PubMed
    1. Sampson T. R., Saroj S. D., Llewellyn A. C., Tzeng Y. L., Weiss D. S. (2013) A CRISPR/Cas system mediates bacterial innate immune evasion and virulence. Nature 497, 254–257 - PMC - PubMed

Publication types