Review
. 2014 Aug 15;592(16):3345-69.
doi: 10.1113/jphysiol.2013.270280. Epub 2014 Jun 6.

Transcranial cerebellar direct current stimulation and transcutaneous spinal cord direct current stimulation as innovative tools for neuroscientists

Affiliations
Review

Transcranial cerebellar direct current stimulation and transcutaneous spinal cord direct current stimulation as innovative tools for neuroscientists

Alberto Priori et al. J Physiol. .

Abstract

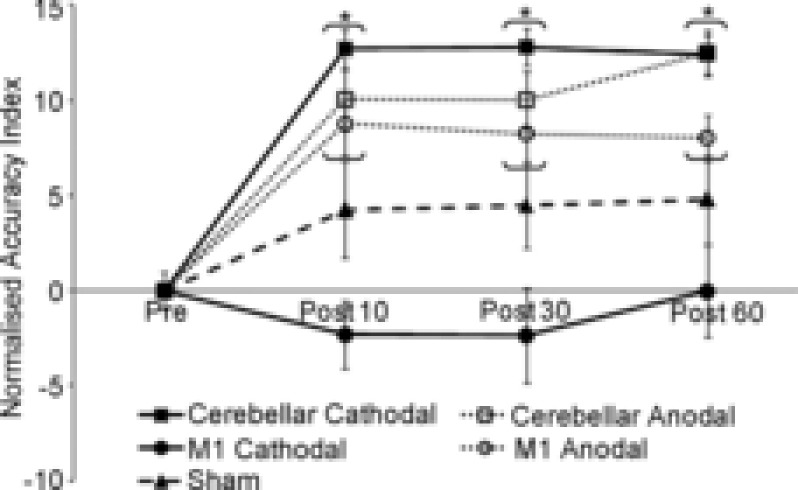
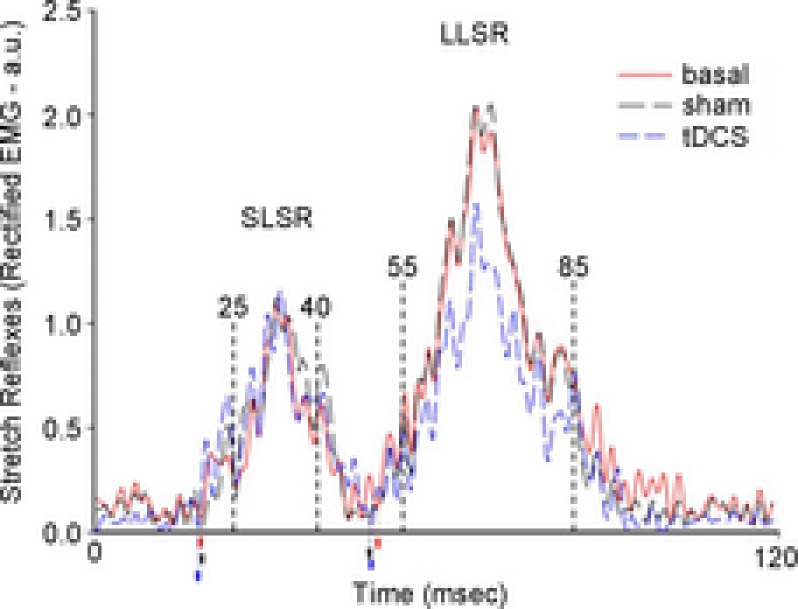
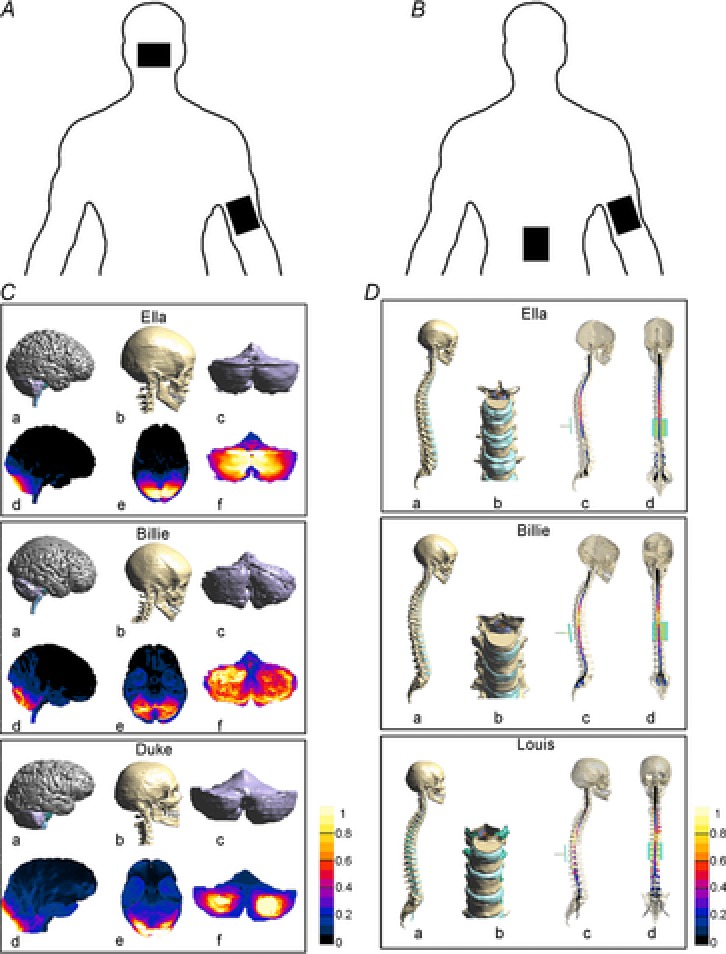
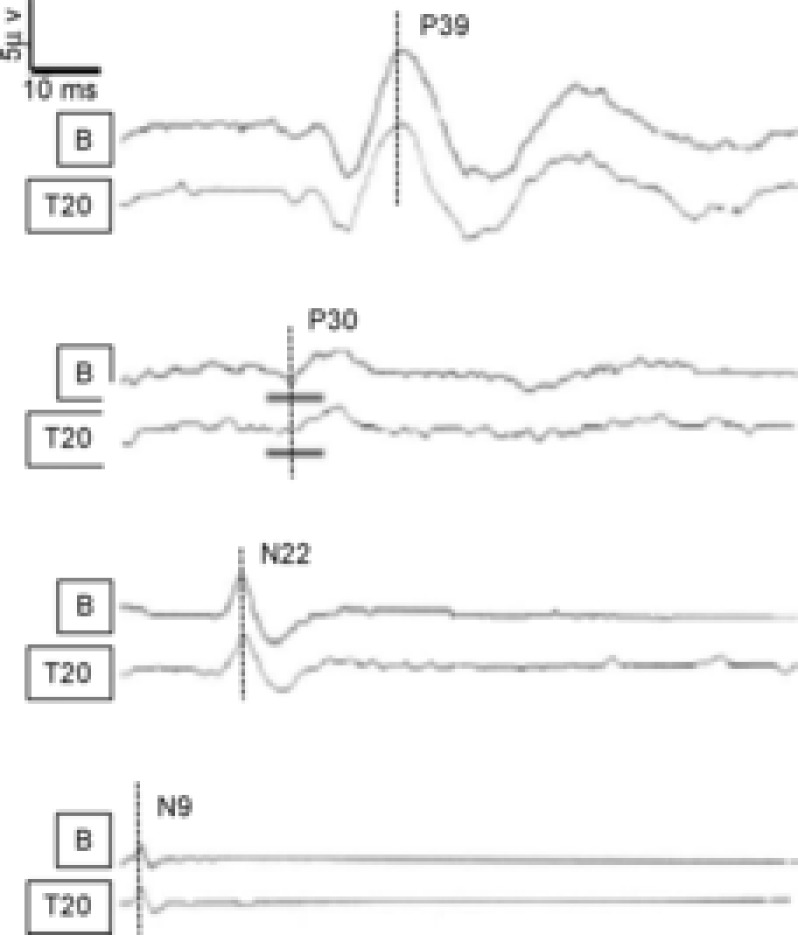
Two neuromodulatory techniques based on applying direct current (DC) non-invasively through the skin, transcranial cerebellar direct current stimulation (tDCS) and transcutaneous spinal DCS, can induce prolonged functional changes consistent with a direct influence on the human cerebellum and spinal cord. In this article we review the major experimental works on cerebellar tDCS and on spinal tDCS, and their preliminary clinical applications. Cerebellar tDCS modulates cerebellar motor cortical inhibition, gait adaptation, motor behaviour, and cognition (learning, language, memory, attention). Spinal tDCS influences the ascending and descending spinal pathways, and spinal reflex excitability. In the anaesthetised mouse, DC stimulation applied under the skin along the entire spinal cord may affect GABAergic and glutamatergic systems. Preliminary clinical studies in patients with cerebellar disorders, and in animals and patients with spinal cord injuries, have reported beneficial effects. Overall the available data show that cerebellar tDCS and spinal tDCS are two novel approaches for inducing prolonged functional changes and neuroplasticity in the human cerebellum and spinal cord, and both are new tools for experimental and clinical neuroscientists.


Figures

Figure 1
Figure 1. Effects of cerebellar transcranial direct current stimulation (cerebellar tDCS) on human lower-limb tracking accuracy
The y-axis depicts the accuracy index normalised to baseline during practice, and the x-axis shows the different time-points: baseline, 10 min after practice (Post 10), 30 min after practice (Post 30) and 60 min after practice (Post 60). The normalised accuracy index improved more after cathodal cerebellar tDCS, anodal cerebellar tDCS and anodal M1 than after sham and cathodal M1 stimulations at all post time-points. Reproduced from Shah et al. (2013), with permission.
Figure 2
Figure 2. Effect of cerebellar transcranial direct current stimulation (cerebellar tDCS) on stretch reflexes in an ataxic subject
The figure shows rectified and averaged EMG signal from the flexor carpi radialis muscle in a cerebellar patient. Reflexes were elicited by passive wrist extension elicited by a torque motor. Anodal cerebellar tDCS left short-latency stretch reflex (SLSR) amplitudes unchanged but reduced amplitudes for long-latency stretch reflexes (LLSR). Reproduced from Grimaldi & Manto (2013), with permission.
Figure 3
Figure 3. Modelling study on the current density generated by cerebellar transcranial direct current stimulation (cerebellar tDCS) and by transcutaneous spinal cord direct current stimulation (spinal tDCS) in humans
Top panels show a schematic drawing illustrating (viewed from the back) the electrode positions for cerebellar tDCS (A) and spinal tDCS (B). C, Examples of segmented tissues in three human realistic Virtual Family models (Ella, Billie and Duke) undergoing cerebellar tDCS: a, lateral view of cerebellum, pons, midbrain, medulla; b, lateral view of the skull; c, back view of the cerebellum; d and e, lateral and inferior views of normalized current density amplitude field distributions over cortical, subcortical and brainstem regions; f, back view of normalized current density amplitude field distributions over the cerebellum. The values are normalized with respect to the maximum of the current density amplitude in the cerebellum. Note that cerebellar tDCS generates the highest current density in the posterior cerebellum with a slight spread to other structures. Reproduced from Parazzini et al. (2014b2014b), with permission. D, Examples of segmented tissues in three human realistic Virtual Family models undergoing spinal tDCS: a, lateral view of skull, and spine; b, magnified clipped frontal view of the spine around the tenth thoracic vertebra; lateral (c) and frontal (d) views of the normalized current density amplitude field distributions over spinal cord. The values are normalized with respect to the maximum of the current density amplitude in the spinal cord. Note that with the reference electrode over the right arm spinal tDCS acts mainly at thoracic level with minimal current spread. Reproduced from Parazzini et al. (2014a2014a) with permission.
Figure 4
Figure 4. Effects of transcutaneous spinal cord stimulation (spinal tDCS) on the somatosensory-evoked potentials (SEPs)
SEPs were obtained after posterior tibial nerve stimulation at the ankles. Activity was measured at the popliteal fossa (popliteal potential, N9), at the first lumbar vertebra referred to the umbilicus (spinal potential, N22), at the sixth cervical vertebra referred to Fpz (cervico-medullary potential, P30) and at Cz referred to the right earlobe (cortical potential, P39). The amplitude and latency for each SEP component were measured at two time points (B, before spinal tDCS; T20, 20 min after spinal tDCS offset). From the top, pairs of traces are P39, P30, N22 and N9. In each pair, the top trace is the baseline recording (B), whereas the bottom trace is recorded 20 min after DC offset (T20). Note that anodal spinal tDCS (2.5 mA, 15 min) decreases the amplitude of the cervico-medullary potential (P30, second pair of traces from the top, grey lines). Conversely spinal tDCS leaves the other potentials unchanged. Modified from Cogiamanian et al. , with permission.
Figure 5
Figure 5. Effects of transcutaneous spinal cord direct current stimulation (spinal tDCS) on laser-evoked potentials (LEPs)
A, spinal tDCS set-up: active electrode on the lower thoracic spinal cord, reference electrode on the right shoulder. B, perioral and foot LEPs in a representative subject. Laser pulses were applied to the right perioral region (Ba) and to the right foot (Bb). LEP N2 and P2 components were recorded from the vertex (Cz with reference on the nose); the N1 component was recorded from the temporal area (T3, reference on Fz). Peak latency and baseline to peak amplitude were measured before and after anodal (on the left) and cathodal (on the right) stimulation. Ba, perioral LEPs before (Baseline) and after (Conditioned) anodal and cathodal DC (2.5 mA, 20 min). Bb, foot LEPs before (Baseline) and after (Conditioned) spinal tDCS. Note that anodal spinal tDCS decreased N1 and N2 amplitude of foot-evoked LEPs (Bb, grey oval) but not of perioral-evoked responses (Ba, left column). Modified from Truini et al. , with permission.
Figure 6
Figure 6. Effects of transcutaneous spinal cord direct current stimulation (spinal tDCS) on the H-reflex recruitment curve
The soleus H-reflex was elicited by stimulating the posterior tibial nerve with pulses lasting 1 ms at a stimulation frequency of 0.33 Hz. The stimulation intensity was progressively increased in 5 to 10% steps of the threshold intensity to evoke an M wave. Five responses were averaged at each stimulus intensity. On the left, the figure shows the differential effect of spinal tDCS on a methionine allele carrier (A) and valine/valine carrier (B). Note that anodal spinal tDCS shifts the curve to the left only in subjects with the valine/valine polymorphism in the BDNF gene (B, leftward shift in the H-reflex recruitment curve, arrows). On the right side, graphic representation showing the effect of anodal spinal tDCS in two representative subjects (raw traces), one from each group (top traces, methionine allele carrier; bottom traces, valine carrier). Black arrows indicate amplitude changes after current offset (T2). Note that in the methionine carrier the H-reflex appeared at the same stimulation intensity (top), whereas in the valine carrier the H-reflex appeared at a lower intensity after spinal tDCS. T0, baseline; Per2, second online recording; T2, 15 min after DC stimulation offset; MT, threshold intensity to evoke an M wave. Modified from Lamy et al. , with permission.
Figure 7
Figure 7. Effects of anodal transcutaneous spinal cord direct current stimulation (spinal tDCS) on the lower limb flexion reflexes (LL-Fr)
A, trace B (baseline) shows a typical LL-Fr recording from a representative healthy subject. LL-Fr is a polysynaptic spinal reflex elicited by electrical stimulation applied to a sensory nerve. LL-Fr comprises an early response (RIIr) and a late response (RIIIr). RIIIr is a high-threshold nociceptive Aδ fibre-mediated reflex that corresponds to the pain threshold (RIIIr threshold) and pain perception (RIIIr size). LL-Fr was elicited from the sural nerve and responses were recorded from the ipsilateral brevis head of the biceps femoris muscle. The stimulus (5 electrical pulses, pulse duration 1 ms, frequency 200 Hz) was delivered randomly every 5–20 s. The stimulus intensity was set at 120% of RIIIr threshold (average of 5 responses for each leg). RIIIr decreased after anodal spinal tDCS (grey circle) immediately after (T0) and 30 min (T30) after stimulation ended. Sham stimulation left RIII area unchanged (B). Modified from Cogiamanian et al. , with permission.

References

    1. Aguilar J, Pulecchi F, Dilena R, Oliviero A, Priori A. Foffani G. Spinal direct current stimulation modulates the activity of gracile nucleus and primary somatosensory cortex in anaesthetized rats. J Physiol. 2011;589:4981–4996. - PMC - PubMed
    1. Ahmed Z. Trans-spinal direct current stimulation modulates motor cortex-induced muscle contraction in mice. J Appl Physiol (1985) 2011;110:1414–1424. - PubMed
    1. Ahmed Z. Effects of cathodal trans-spinal direct current stimulation on mouse spinal network and complex multijoint movements. J Neurosci. 2013a;33:14949–14957. - PMC - PubMed
    1. Ahmed Z. Electrophysiological characterization of spino-sciatic and cortico-sciatic associative plasticity: modulation by trans-spinal direct current and effects on recovery after spinal cord injury in mice. J Neurosci. 2013b;33:4935–4946. - PMC - PubMed
    1. Ahmed Z. Wieraszko A. Trans-spinal direct current enhances corticospinal output and stimulation-evoked release of glutamate analog, d-2,3-3H-aspartic acid. J Appl Physiol (1985) 2012;112:1576–1592. - PubMed

Publication types

MeSH terms