Genomic heterogeneity and ecological speciation within one subspecies of Bacillus subtilis
- PMID: 24907327
- PMCID: PMC4135754
- DOI: 10.1128/AEM.00576-14
Genomic heterogeneity and ecological speciation within one subspecies of Bacillus subtilis
Abstract
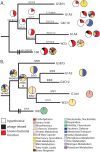
Closely related bacterial genomes usually differ in gene content, suggesting that nearly every strain in nature may be ecologically unique. We have tested this hypothesis by sequencing the genomes of extremely close relatives within a recognized taxon and analyzing the genomes for evidence of ecological distinctness. We compared the genomes of four Death Valley isolates plus the laboratory strain W23, all previously classified as Bacillus subtilis subsp. spizizenii and hypothesized through multilocus analysis to be members of the same ecotype (an ecologically homogeneous population), named putative ecotype 15 (PE15). These strains showed a history of positive selection on amino acid sequences in 38 genes. Each of the strains was under a different regimen of positive selection, suggesting that each strain is ecologically unique and represents a distinct ecological speciation event. The rate of speciation appears to be much faster than can be resolved with multilocus sequencing. Each PE15 strain contained unique genes known to confer a function for bacteria. Remarkably, no unique gene conferred a metabolic system or subsystem function that was not already present in all the PE15 strains sampled. Thus, the origin of ecotypes within this clade shows no evidence of qualitative divergence in the set of resources utilized. Ecotype formation within this clade is consistent with the nanoniche model of bacterial speciation, in which ecotypes use the same set of resources but in different proportions, and genetic cohesion extends beyond a single ecotype to the set of ecotypes utilizing the same resources.
Copyright © 2014, American Society for Microbiology. All Rights Reserved.
Figures


Similar articles
-
Ecology of speciation in the genus Bacillus.Appl Environ Microbiol. 2010 Mar;76(5):1349-58. doi: 10.1128/AEM.01988-09. Epub 2010 Jan 4. Appl Environ Microbiol. 2010. PMID: 20048064 Free PMC article.
-
The genome sequence of Bacillus subtilis subsp. spizizenii W23: insights into speciation within the B. subtilis complex and into the history of B. subtilis genetics.Microbiology (Reading). 2011 Jul;157(Pt 7):2033-2041. doi: 10.1099/mic.0.048520-0. Epub 2011 Apr 28. Microbiology (Reading). 2011. PMID: 21527469
-
Genomic insights into the taxonomic status of the three subspecies of Bacillus subtilis.Syst Appl Microbiol. 2014 Mar;37(2):95-9. doi: 10.1016/j.syapm.2013.09.006. Epub 2013 Nov 11. Syst Appl Microbiol. 2014. PMID: 24231292
-
Ecology and genomics of Bacillus subtilis.Trends Microbiol. 2008 Jun;16(6):269-75. doi: 10.1016/j.tim.2008.03.004. Epub 2008 May 28. Trends Microbiol. 2008. PMID: 18467096 Free PMC article. Review.
-
Bacterial species and speciation.Syst Biol. 2001 Aug;50(4):513-24. doi: 10.1080/10635150118398. Syst Biol. 2001. PMID: 12116650 Review.
Cited by
-
Evidence of episodic positive selection in Corynebacterium diphtheriae complex of species and its implementations in identification of drug and vaccine targets.PeerJ. 2022 Feb 16;10:e12662. doi: 10.7717/peerj.12662. eCollection 2022. PeerJ. 2022. PMID: 35190783 Free PMC article.
-
Isolation and Identification of Bacillus subtilis LY-1 and Its Antifungal and Growth-Promoting Effects.Plants (Basel). 2023 Dec 14;12(24):4158. doi: 10.3390/plants12244158. Plants (Basel). 2023. PMID: 38140485 Free PMC article.
-
Ecological genomics in Xanthomonas: the nature of genetic adaptation with homologous recombination and host shifts.BMC Genomics. 2015 Mar 15;16(1):188. doi: 10.1186/s12864-015-1369-8. BMC Genomics. 2015. PMID: 25879893 Free PMC article.
-
Comparative Genomics of cpn60-Defined Enterococcus hirae Ecotypes and Relationship of Gene Content Differences to Competitive Fitness.Microb Ecol. 2016 Nov;72(4):917-930. doi: 10.1007/s00248-015-0708-2. Epub 2015 Nov 14. Microb Ecol. 2016. PMID: 26566933
-
Recombination Does Not Hinder Formation or Detection of Ecological Species of Synechococcus Inhabiting a Hot Spring Cyanobacterial Mat.Front Microbiol. 2016 Jan 14;6:1540. doi: 10.3389/fmicb.2015.01540. eCollection 2015. Front Microbiol. 2016. PMID: 26834710 Free PMC article.
References
-
- Madigan MT, Martinko JM, Dunlap PV, Clark DP. 2009. Brock biology of microorganisms, 12th ed. Pearson Benjamin Cummings, San Francisco, CA
Publication types
MeSH terms
LinkOut - more resources
Full Text Sources
Other Literature Sources

