. 2014 Sep;13(9):904-11.
doi: 10.1038/nmat3982. Epub 2014 Jun 8.

Etchable plasmonic nanoparticle probes to image and quantify cellular internalization

Affiliations

Etchable plasmonic nanoparticle probes to image and quantify cellular internalization

Gary B Braun et al. Nat Mater. 2014 Sep.

Abstract

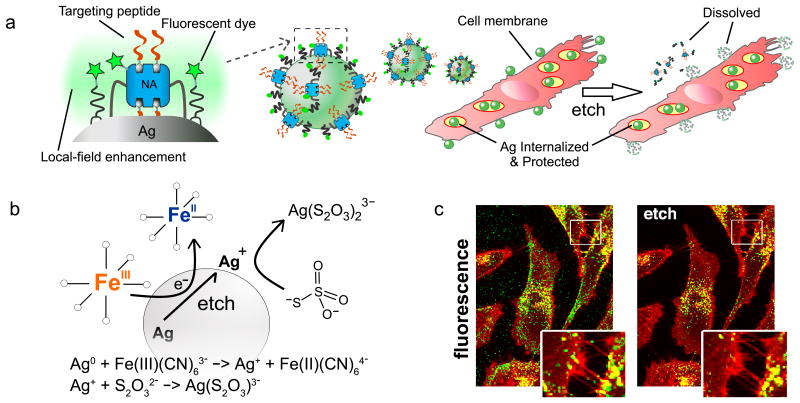
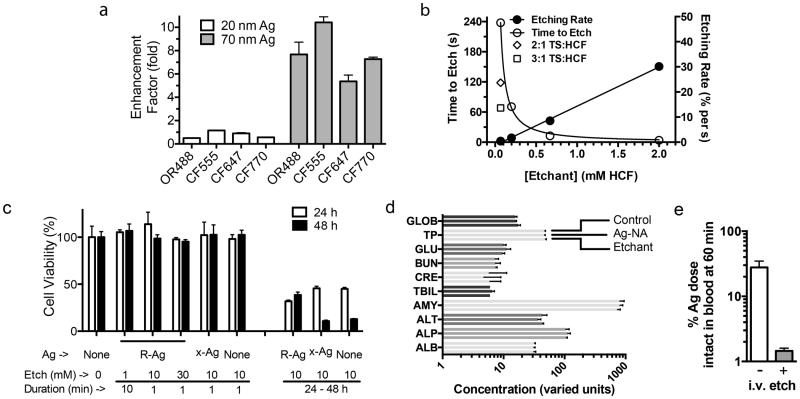
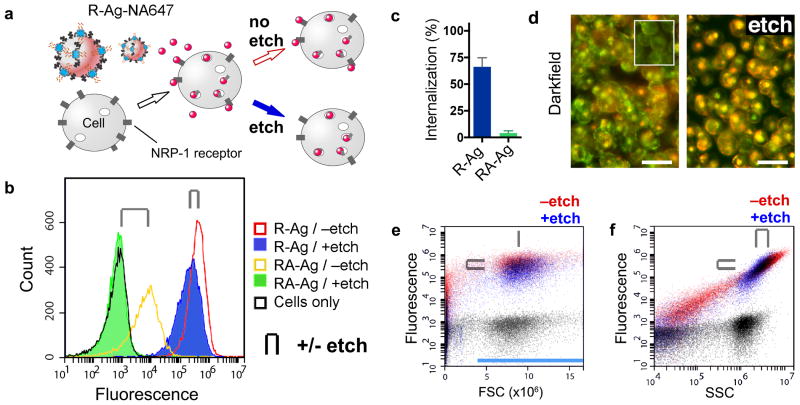
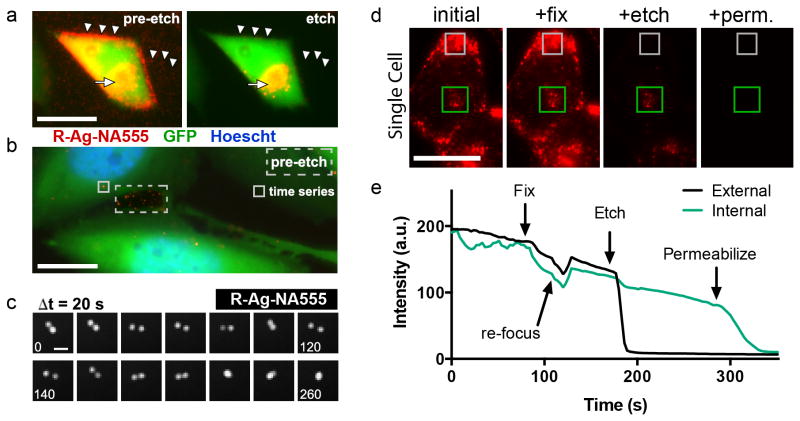
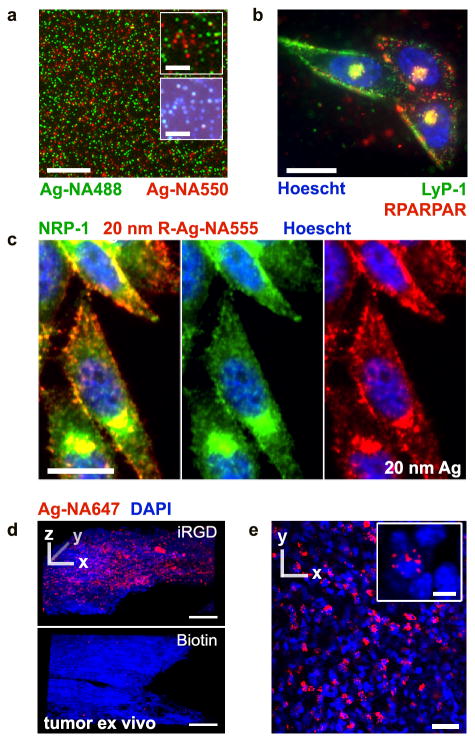
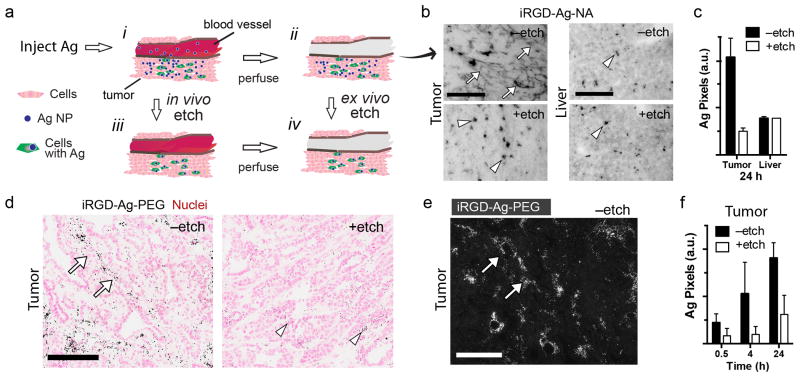
There is considerable interest in using nanoparticles as labels or to deliver drugs and other bioactive compounds to cells in vitro and in vivo. Fluorescent imaging, commonly used to study internalization and subcellular localization of nanoparticles, does not allow unequivocal distinction between cell surface-bound and internalized particles, as there is no methodology to turn particles 'off'. We have developed a simple technique to rapidly remove silver nanoparticles outside living cells, leaving only the internalized pool for imaging or quantification. The silver nanoparticle (AgNP) etching is based on the sensitivity of Ag to a hexacyanoferrate-thiosulphate redox-based destain solution. In demonstration of the technique we present a class of multicoloured plasmonic nanoprobes comprising dye-labelled AgNPs that are exceptionally bright and photostable, carry peptides as model targeting ligands, can be etched rapidly and with minimal toxicity in mice, and that show tumour uptake in vivo.


Figures

Figure 1
Figure 1. Dye-labeled, peptide functionalized silver nanoparticles (AgNPs) and their etching for cell internalization and tracking
(a) Scheme of AgNPs coated with NeutrAvidin-PEG-thiol (NA) and lipoic-PEG-amine, each having attached fluorescent dyes (stars) with brightness enhanced by the local plasmonic field. Attachment of biotinylated internalizing peptide RPARPAR forms the complete Ag nanoprobe (R-Ag-NA488). These bind to and are taken up by cells, which are treated with exposure to etchant solution to remove extracellular particles. Plasmonic enhancement is lost for etched particles. (b) Etching reagents hexacyanoferrate (HCF) and thiosulfate (TS) oxidize and stabilize silver ions, respectively, releasing components into solution and dissolving the core. (c) Fluorescence confocal microscopy of cells incubated with R-Ag-NA488 (green) and membrane stain (red) shows how R-Ag-NA488 is retained selectively in cells when etched (right). Endosomal membranes strongly overlap with nanoparticles, appearing as yellow in the overlay.
Figure 2
Figure 2. Nanoparticle characterization and toxicity screening
(a) Enhancement factor (EF) for several commonly used dyes shows a strong dependence for size of the Ag core. EF was calculated from the ratio of fluorescence for unetched/etched Ag-NA-dye conjugates. The approximate peak absorption value of the dye is on the x-axis. Error bars = S.D. from replicate wells. OR488, Oregon Green 488; CF dyes from Biotium. (b) Etching kinetics for Ag-NA depends linearly on the concentration and the molar ratio of the etchant components TS:HCF. The decrease in scattering intensity from the Ag plasmon band upon etching was used to calculate a rate, and the time to reach 10% of the initial value is plotted. 1:1 TS:HCF except where indicated, Ag-NA (70 nm core) concentration fixed in all conditions. (c) PPC-1 cells with RPARPAR Ag-NA (R-Ag) and etching showed no effect on 48 h viability (resazurin assay) for short-term exposures to etchant. N=6. Values normalized to the condition of no Ag, no etchant. Ag-NA without peptide, x-Ag, does not internalize into cells. Etchant concentration and duration of contact with cells is indicated. (d) In vivo blood chemistry was evaluated 24 h after x-Ag-NA or etchant injection. Marker levels were not significantly different from those for a PBS control injection, see Supporting Information for additional plots. Error bars = S.D. N=3-6 mice. (e) The etchant was capable of etching pre-injected Ag in mice. Ag was injected into the tail vein then 20 min later followed by either etchant or PBS injection, and blood was analyzed for fluorescence at 60 min. Values were normalized to % of fluorescence at 5 min. Ag had been labeled with CF555 and PEG for blood etching, see Supporting Information. Error bars = S.D., N=2. Terms and units for d: GLOB, globulin g/L; TP, total protein g/L; GLU, glucose mM; BUN, blood urea nitrogen mM; CRE, creatinine μM; TBIL, total bilirubin μM; AMY, amylase units/L; ALT, alanine transaminase units/L; ALP, alkaline phosphatase units/L; ALB, albumin g/L.
Figure 3
Figure 3. Flow cytometry with AgNPs
(a) Scheme of CendR peptide RPARPAR dependent R-Ag-NA647 binding to NRP-1 expressing cells. After splitting into two samples one is etched. (b) Fluorescence histograms of cells with Ag-NA647 carrying either of two peptides. Cell-gated plots of internalizing R-Ag-NA647 (red, -etch), and with etch (blue), versus non-internalizing control, RPARPARA (RA)-Ag-NA647 (yellow, -etch) and with etch (green). Cells without Ag were included as a control (black). Paired +/- etch is indicated in all panels by the clip icon. (c) Internalization into cells was quantified from b as the percent of mean signal retained after etching. Error bars (S.D.) were generated across five separate incubations and cytometric runs. (d) Darkfield imaging of cell suspensions with R-Ag-NA647 shows that etched cells lose the membrane puncta (Ag) but retain the perinuclear (and red-shifted) scattering spectra from internalized Ag. Inset shows cells without AgNPs. Scale bars are 25 μm. (e) R-Ag-NA647 from b plotted as ungated dot plots in fluorescence versus forward scatter (FSC) or (panel f) side scatter (SSC). Black dot plots are from cells-only control. In e, FSC detected cells but the signal did not shift when cells were bound with R-Ag-NA647; only y-axis fluorescence shifts were observed. FSC thus served as a stable gate parameter, indicated by the blue bar, and was used for creating panel b. In f, both SSC and fluorescence increased due to R-Ag-NA647 (red). Etching caused a slight loss in signal from cells (upper-right population), attributed to the etching away of membrane-bound Ag, and a loss of events below the cell-minimum SSC at ∼106 counts was attributed to free R-Ag-NA647 or debris.
Figure 4
Figure 4. Tracking AgNPs within live cells
(a) Epifluorescence microscopy of GFP-expressing PC-3 cells after binding and endocytosing R-Ag-NA555. These cells express the NRP-1 receptor. R-Ag-NA555 appears red when not associated with the GFP in cells, and these were removed by etching (arrowheads). The yellow color represents cell-associated R-Ag-NA555, due to spatial overlap with the cells, indicated by the full arrow. See also Supplementary Movie S8. (b) Intracellular tracking was possible by time-lapse epifluorescence imaging when a lower amount of R-Ag-NA555 was added with shorter incubation time. This post-etch image shows only a small number of red objects survived etching, and a pre-etch image of a region outside the cells (dashed box) is overlaid to show the representative intensity from R-Ag-NA555 that had adsorbed to the substrate. A region inside the cell body (solid box) was chosen for the time series presented in c. (c) R-Ag-NA555 moved within the cell and relative to each other. Each frame advances forward by 20 s, with numbers in frames indicating the elapsed time. The two structures undergo an apparent fusion event at +220 s. (d) R-Ag-NA555 were incubated with PC-3-GFP cells and imaged during the sequential procedure of fixing (fix), etching, and permeabilization (perm.). Representative regions for R-Ag-NA555 that were internalized (green box), and a region of bound but external particles (gray box). (e) Time trace of the mean pixel intensity of the regions in d with each reagent added without washing. Rapid drops in intensity were due to etching of Ag and the gradual downward slope is due to fluorescence photobleaching. Two cells were averaged for this trace. Scale bars are 25 μm in a, 10 μm in b, 1 μm in c, 25 μm in d.
Figure 5
Figure 5. Distinguishing individual AgNPs of different colors, in cancer cells and tumors
(a) Microscopy analysis of a mixture of Ag-NA488 (green) and Ag-NA550 (red) on a glass slide, 20× objective. Insets show single nanoparticle detection in epifluorescence (upper) and color darkfield (lower). (b) PPC-1 cells were incubated with the mixture of green and red Ag-NA, carrying Lyp-1 and RPARPAR peptides, respectively. The difference in binding between cells reflects receptor specific binding, with colocalization in endosomes occuring near the nucleus (Hoescht, blue), 100× objective. (c) Smaller 20 nm R-Ag-NA555 (red) imaged by epifluorescence after incubation with PPC-1 cells and counterstaining with anti-NRP-1 antibody, Alexa Fluor 488 secondary antibody (green), and Hoescht. (d) Living tumor slices of 200 μm thickness were prepared from resected tumors and cultured in media. Confocal laser microscopy was performed after incubation and etching of (top) iRGD-Ag-NA647 or (bottom) biotin Ag-NA647 as a non-peptide control. Strong internalization was seen with iRGD. Z-stacks were collected through 60 μm total thickness, step size 2 μm, 20× objective. (e) 2D slice from d, top, for iRGD-Ag-NA647. Inset shows the perinuclear localization in red, 40× objective. Scale bars are 25 μm except in a-inset 5 μm, d 100 μm, and in e-inset 5 μm. DyLight 488 and 550 were used in a and b, CF555 in c, and CF647 in d.
Figure 6
Figure 6. In vivo etching
(a) Schematic of in vivo tumor homing, ex vivo and in vivo etching. Stages are: (i) iRGD-Ag-NA homing and extravasation, (ii) tissue perfusion was followed by etching ex vivo, or instead, (iii) in vivo etching followed by perfusion, and (iv) tissue with Ag retained in cells. (b) Brightfield imaging of ex vivo 4T1 tumor and liver tissue sections are presented, ‒etch (upper), +etch (lower). Ag was amplified by autometallography and appeared as dark pixels. Diffuse dark pixels (full arrows) were attributed to extracellular Ag, arrowheads to endosomal Ag. (c) Samples from b were quantified for dark Ag pixels per field as a measure of iRGD-Ag-NA in the tissue. (d) In vivo etching with MMTV-PyMT tumors. Mice were perfused at 0.5, 4, or 24 h hours post injection of iRGD-Ag-PEG, and selected mice (+etch) were injected with etchant 10 min prior to perfusion. Shown are representative tumor tissue sections from 4 h –etch (left), + etch (right). (e) Darkfield imaging of Ag amplified section (4 h, –etch) shows strong signals (arrows) consistent with the pattern in brightfield, d. Note: this image has no nuclear counterstain and was taken from a separate section than d. (f) Tumor samples from d were quantified for dark Ag pixels per field, representing the amount of iRGD-Ag-PEG in the tissue for the indicated circulation times. Error bars = S.D. with N>2 randomly chosen fields per condition in c, N>4 in f. Scale bars are 100 μm in b,d,e.

Comment in

  • Etching away at the surface.
    Vogt N. Vogt N. Nat Methods. 2014 Aug;11(8):790. doi: 10.1038/nmeth.3059. Nat Methods. 2014. PMID: 25229099 No abstract available.

References

    1. Tassa C, Shaw SY, Weissleder R. Dextran-coated iron oxide nanoparticles: a versatile platform for targeted molecular imaging, molecular diagnostics, and therapy. Accounts of chemical research. 2011;44:842–852. doi: 10.1021/ar200084x. - DOI - PMC - PubMed
    1. Ruoslahti E. Peptides as Targeting Elements and Tissue Penetration Devices for Nanoparticles. Adv Mater. 2012 doi: 10.1002/adma.201200454. - DOI - PMC - PubMed
    1. Chithrani BD, Chan WC. Elucidating the mechanism of cellular uptake and removal of protein-coated gold nanoparticles of different sizes and shapes. Nano letters. 2007;7:1542–1550. doi: 10.1021/nl070363y. - DOI - PubMed
    1. Goulet PJ, Bourret GR, Lennox RB. Facile phase transfer of large, water-soluble metal nanoparticles to nonpolar solvents. Langmuir : the ACS journal of surfaces and colloids. 2012;28:2909–2913. doi: 10.1021/la2038894. - DOI - PubMed
    1. Moller J, et al. Dissolution of iron oxide nanoparticles inside polymer nanocapsules. Physical chemistry chemical physics : PCCP. 2011;13:20354–20360. doi: 10.1039/c1cp22161b. - DOI - PubMed

Publication types