. 2014 Jul;46(7):685-92.
doi: 10.1038/ng.3009. Epub 2014 Jun 8.

Quantitative genome-wide enhancer activity maps for five Drosophila species show functional enhancer conservation and turnover during cis-regulatory evolution

Affiliations

Quantitative genome-wide enhancer activity maps for five Drosophila species show functional enhancer conservation and turnover during cis-regulatory evolution

Cosmas D Arnold et al. Nat Genet. 2014 Jul.

Abstract

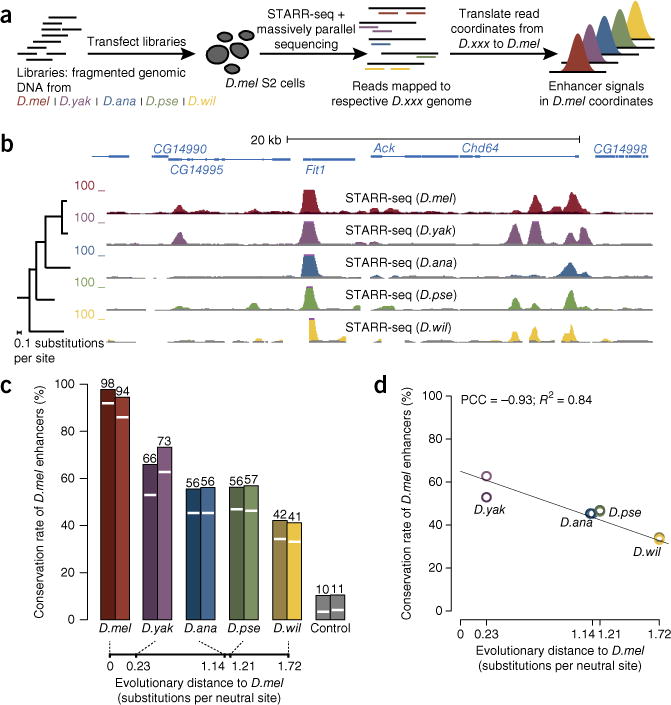
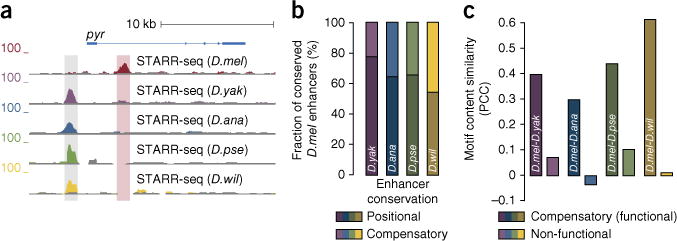
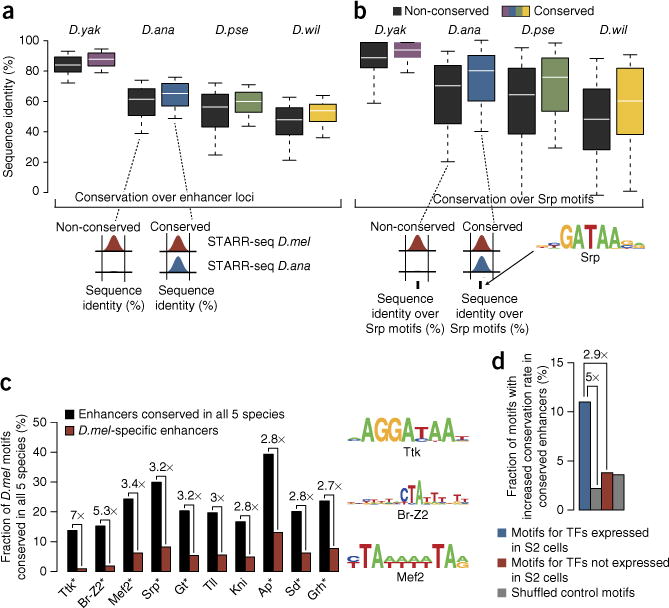
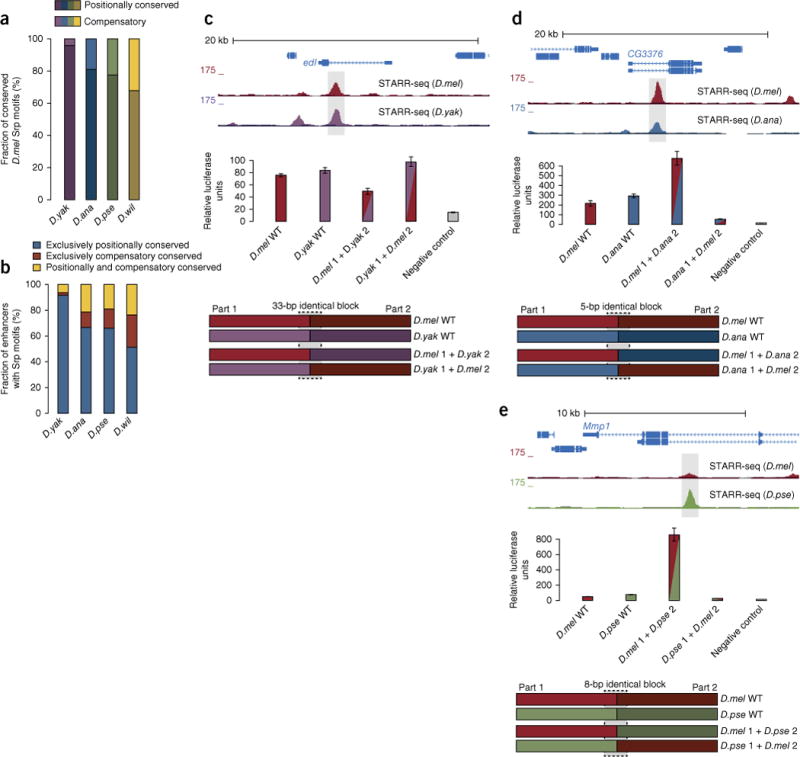
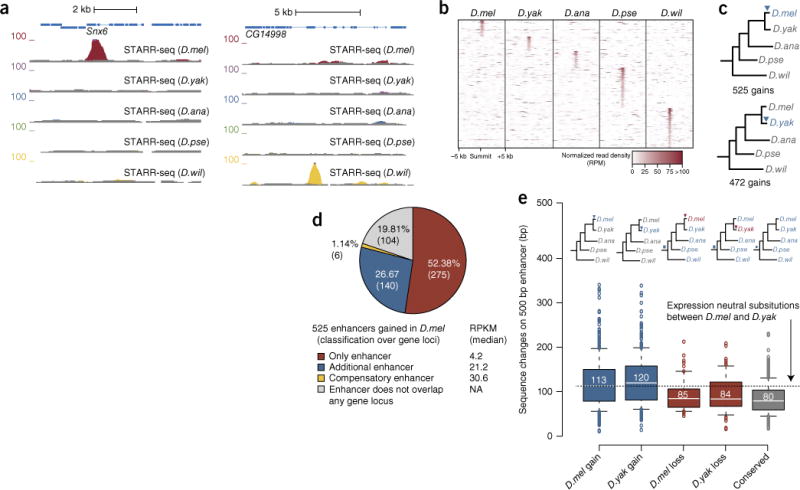
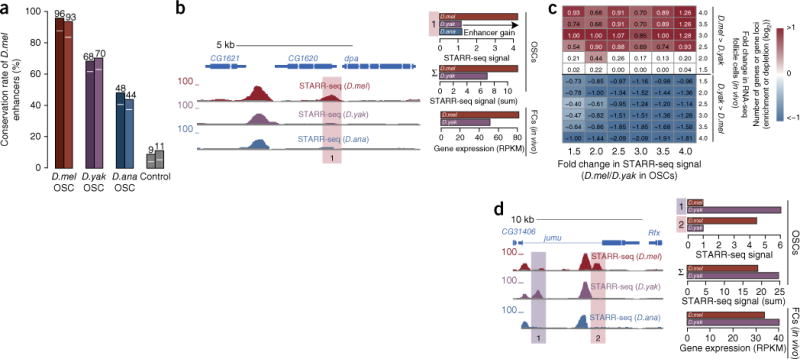
Phenotypic differences between closely related species are thought to arise primarily from changes in gene expression due to mutations in cis-regulatory sequences (enhancers). However, it has remained unclear how frequently mutations alter enhancer activity or create functional enhancers de novo. Here we use STARR-seq, a recently developed quantitative enhancer assay, to determine genome-wide enhancer activity profiles for five Drosophila species in the constant trans-regulatory environment of Drosophila melanogaster S2 cells. We find that the functions of a large fraction of D. melanogaster enhancers are conserved for their orthologous sequences owing to selection and stabilizing turnover of transcription factor motifs. Moreover, hundreds of enhancers have been gained since the D. melanogaster-Drosophila yakuba split about 11 million years ago without apparent adaptive selection and can contribute to changes in gene expression in vivo. Our finding that enhancer activity is often deeply conserved and frequently gained provides functional insights into regulatory evolution.


Conflict of interest statement

COMPETING FINANCIAL INTERESTS

The authors declare no competing financial interests.

Figures

Figure 1
Figure 1
Functional conservation of D. melanogaster S2 cell enhancers. (a) Schematic overview of STARR-seq enhancer screens for the genomes from different Drosophila species (D.mel, D. melanogaster; D.yak, D. yakuba; D.ana, D. ananassae; D.pse, D. pseudoobscura; D.wil, D. willistoni; D.xxx, any Drosophila species) in a single cell type (here D. melanogaster S2 cells). (b) UCSC Genome Browser screenshot depicting a 30-kb genomic locus with STARR-seq tracks for each species (inputs in gray; y axes depict normalized fragment counts). (c) Functional conservation rates of D. melanogaster enhancers in the four other Drosophila species (white lines, P ≤ 0.001; bar heights, P ≤ 0.05; n = 2,325 enhancers). Background conservation levels were assessed using shifted genomic coordinates as controls. For D. melanogaster, conservation rates between biological replicates are shown (n = 2,139 and 2,361 enhancers; see supplementary Fig. 1 for replicates in the other species and supplementary Fig. 3 for the separate analysis of open and closed enhancers). The evolutionary distances of each species from D. melanogaster are indicated (bottom). (d) Conservation rates from c (stringent cutoff of P ≤ 0.001) versus the pairwise evolutionary distance of each species to D. melanogaster (darker and lighter colors depict replicates 1 and 2, respectively).
Figure 2
Figure 2
Compensatory enhancers stabilize total enhancer strengths for gene loci. (a) D. melanogaster lost a deeply conserved enhancer upstream of the pyr gene (shaded in gray) but gained an intronic enhancer in the same gene locus (shaded in red; UCSC Genome Browser screenshot; details as in Fig. 1b). (b) The fraction of compensatory versus positional enhancer conservation increases with evolutionary distance. Shown are the relative contributions of positional (bottom) and compensatory (top) enhancer conservation for all pairwise comparisons of D. melanogaster with each of the other species (for absolute contributions, see supplementary Fig. 4). (c) Motif similarity of compensatory enhancers. Pairs of putative compensatory enhancers have motif content that is more similar than their respective non-functional orthologous sequences (measured by PCC for motif enrichment; numbers of compensatory enhancer pairs considered (left to right): 28, 37, 74 and 69).
Figure 3
Figure 3
Motif conservation by positional sequence constraints. (a) Pairwise sequence identity for functionally non-conserved (black) and conserved (colored) enhancers along the entire 501-bp D. melanogaster enhancer sequences (boxes depict the median and interquartile range, and whiskers depict the 10th and 90th percentiles). (b) Sequence identity as in a but restricted to positions within the 501-bp enhancer sequences that match motifs for the Srp transcription factor. The number of enhancers examined was (left to right) 214, 338, 413 and 196 in a and 361, 216, 366 and 174 in b. (For equivalent analyses of 101-bp core enhancer regions and the corresponding analyses for an unrelated transcription factor motif, see supplementary Fig. 5). (c) Transcription factor motif conservation in functionally conserved versus non-conserved (D. melanogaster–specific) enhancers. Shown are the ten transcription factors for which motif conservation in functionally conserved enhancers was most strongly increased (numbers on top indicate fold increase; all increases are significant, P ≤ 0.05); eight of these are expressed in S2 cells (an asterisk indicates RPKM ≥ 1; supplementary table 2). (d) Transcription factors (TFs) that are expressed in S2 cells more frequently show increased motif conservation than transcription factors that are not expressed or shuffled control motifs (cutoff P ≤ 0.01; n (left to right) = 91, 91, 160 and 160 motifs).
Figure 4
Figure 4
Compensatory motif turnover in functionally conserved enhancers. (a) Fraction of compensatory motif conservation (top) by turnover compared to positional motif conservation (bottom) for motifs of the Srp transcription factor. (b) Fraction of functionally conserved enhancers with the same number of Srp motifs between species for which all motifs are positionally conserved, all motifs are conserved within the enhancer sequence but not at identical positions (compensatory), or some motifs are positionally conserved and others are compensatory. (For absolute conservation rates, see supplementary Fig. 6.) (c) UCSC Genome Browser screenshot for a D. melanogaster enhancer in the ETS-domain lacking (edl) intron that is functionally conserved in D. yakuba (top; candidate enhancers are shaded in gray) and corresponding wild-type and hybrid enhancer constructs (bottom; details as in Fig. 1b). Highlighted is a sequence block that is identical in both species and allowed a seamless transition between the two halves in the hybrids. Results are shown for luciferase assays of corresponding wild-type (WT) and hybrid enhancer constructs (middle). Negative control refers to a non-enhancer sequence as in ref. . (d, e) Hybrid enhancer tests as in c for two additional enhancers in D. melanogaster and D. ananassae (d) and D. melanogaster and D. pseudoobscura (e). All wild-type enhancers show similar STARR-seq and luciferase activities, whereas the activities of the hybrids deviate substantially from wild-type levels and from each other. Error bars show s.d. from three biological replicates; relative luciferase units were normalized to Renilla luciferase signal.
Figure 5
Figure 5
Species-specific gained enhancers and associated sequence changes. (a) UCSC Genome Browser screenshots with a gained enhancer in D. melanogaster (left) and D. willistoni (right; details as in Fig. 1b). (b) Heat map centered on the enhancer summit positions of species-specific enhancers that show read fragment densities at orthogonal positions across all five screened species. The distant D. pseudoobscura and D. willistoni species in particular contribute a substantial number of species-specific enhancers. RPM, reads per million. (c) Enhancers gained in D. melanogaster or D. yakuba. Shown are the number of gains and the branch in which the gains occurred (blue triangles on phylogenetic trees). (d) Classification of newly gained enhancers that are specific to D. melanogaster. NA, not applicable. (e) Sequence changes between D. melanogaster and D. yakuba across enhancers gained in D. melanogaster or D. yakuba (blue) versus ancient enhancers lost specifically in either D. melanogaster or D. yakuba (red) or deeply conserved ancient enhancers (gray). The dashed line indicates the expected number of sequence changes based on estimates from fourfold-degenerate sites in protein-coding sequences. Boxes depict the median and interquartile range, and whiskers depict the 10th and 90th percentiles; outliers are shown individually. The number of enhancers examined (from left to right) was 525, 472, 69, 84 and 370.
Figure 6
Figure 6
Evolution of enhancer activity in OSCs and gene expression in follicle cells in vivo. (a) Functional conservation rates of D. melanogaster OSC enhancers (as in Fig. 1c; n = 3,342 enhancers; n = 3,077 and 3,313 enhancers for D. melanogaster replicates; see also supplementary Fig. 11d,e). (b) A D. melanogaster–specific OSC enhancer gain correlates with higher gene expression in D. melanogaster follicle cells in vivo. Shown is a screenshot (details as in Fig. 1b) of the CG1620 locus with a D. melanogaster–specific enhancer gain (1; orange) and bar plots that display OSC enhancer activity (STARR-seq signal) at the position of the gained enhancer (top), the sum of OSC enhancer activities for the CG1620 gene locus (middle) and the expression of CG1620 in D. melanogaster and D. yakuba follicle cells (FCs) in vivo (bottom). (c) Changes in OSC enhancer activities and follicle cell in vivo gene expression between D. melanogaster and D. yakuba correlate globally. Genes that are more highly expressed in D. melanogaster (toward the top) also have higher OSC enhancer activities in D. melanogaster on average (their enrichment among genes with ≥1.5- to ≥4-fold higher enhancer activities in D. melanogaster is coded in shades of red). In contrast, genes that are more highly expressed in D. yakuba (toward the bottom) are depleted among genes with high D. melanogaster OSC enhancer activities (shaded in blue). Fold-enrichment values (log2) are depicted in each matrix cell, and cells with enrichments that are not significant (binomial P ≤ 0.05) are set to white (supplementary Fig. 12). (d) A pair of compensatory OSC enhancers in D. melanogaster and D. yakuba stabilizes total enhancer activity, in agreement with similar in vivo gene expression in both species (screenshot as in b). The activities of OSC enhancers in the jumu locus (purple and red shading) change substantially between D. melanogaster and D. yakuba (top), but total OSC enhancer activity for the orthologous loci is balanced (middle), which agrees with similar jumu expression levels in D. melanogaster and D. yakuba follicle cells in vivo (bottom).

References

    1. Carroll SB. Evo-devo and an expanding evolutionary synthesis: a genetic theory of morphological evolution. Cell. 2008;134:25–36. - PubMed
    1. King MC, Wilson AC. Evolution at two levels in humans and chimpanzees. Science. 1975;188:107–116. - PubMed
    1. Wittkopp PJ, Kalay G. Cis-regulatory elements: molecular mechanisms and evolutionary processes underlying divergence. Nat Rev Genet. 2012;13:59–69. - PubMed
    1. Wray GA. The evolutionary significance of cis-regulatory mutations. Nat Rev Genet. 2007;8:206–216. - PubMed
    1. Gompel N, Prud’homme B, Wittkopp PJ, Kassner VA, Carroll SB. Chance caught on the wing: cis-regulatory evolution and the origin of pigment patterns in Drosophila. Nature. 2005;433:481–487. - PubMed

Publication types

Associated data