. 2014 Jun 4;82(5):1045-57.
doi: 10.1016/j.neuron.2014.04.017.

Age-related homeostatic midchannel proteolysis of neuronal L-type voltage-gated Ca²⁺ channels

Affiliations

Age-related homeostatic midchannel proteolysis of neuronal L-type voltage-gated Ca²⁺ channels

Ioannis E Michailidis et al. Neuron. .

Abstract

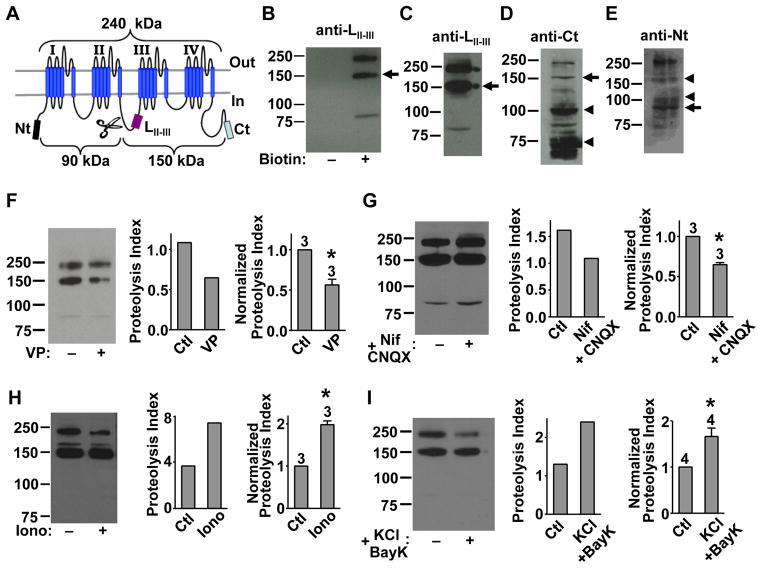
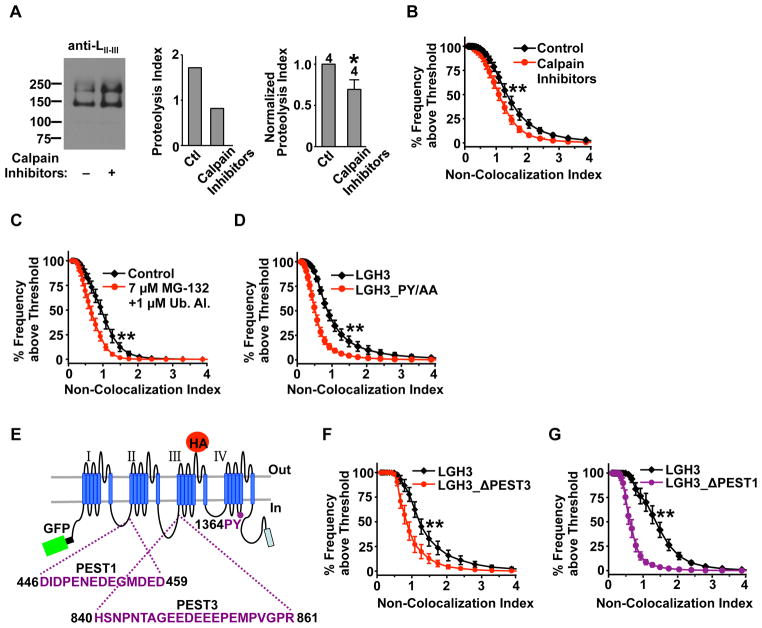
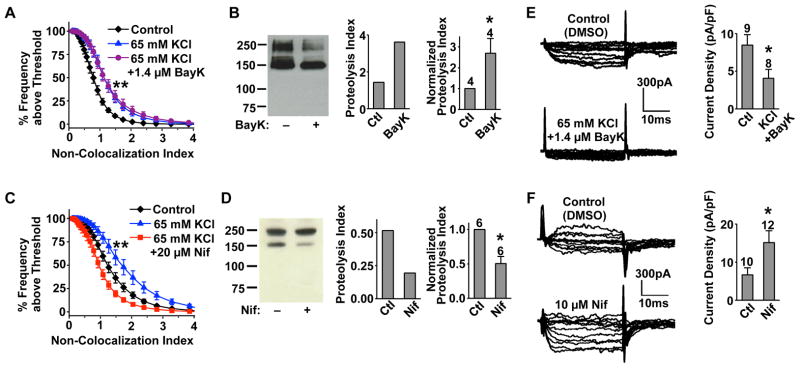
Neural circuitry and brain activity depend critically on proper function of voltage-gated calcium channels (VGCCs), whose activity must be tightly controlled. We show that the main body of the pore-forming α1 subunit of neuronal L-type VGCCs, Cav1.2, is proteolytically cleaved, resulting in Cav1.2 fragment channels that separate but remain on the plasma membrane. This "midchannel" proteolysis is regulated by channel activity, involves the Ca(2+)-dependent protease calpain and the ubiquitin-proteasome system, and causes attenuation and biophysical alterations of VGCC currents. Recombinant Cav1.2 fragment channels mimicking the products of midchannel proteolysis do not form active channels on their own but, when properly paired, produce currents with distinct biophysical properties. Midchannel proteolysis increases dramatically with age and can be attenuated with an L-type VGCC blocker in vivo. Midchannel proteolysis represents a novel form of homeostatic negative-feedback processing of VGCCs that could profoundly affect neuronal excitability, neurotransmission, neuroprotection, and calcium signaling in physiological and disease states.


Figures

Figure 1
Figure 1. Mid-channel proteolysis of native Cav1.2 in cortical neurons and its dependence on channel activity
(A) Domain topology of Cav1.2. Indicated are epitope locations for three antibodies (anti-LII–III, anti-Ct and anti-Nt) and predicted molecular masses for full-length Cav1.2 and two fragment-channels generated by a presumed proteolytic cut (scissors). (B) Western blot with anti-LII–III of native Cav1.2 in surface-biotinylated (+) and non-biotinylated (−) cortical slices from 6-week old rats, showing a 150-kDa band (arrow). (C–E) Western blot with anti-LII–III (C), anti-Ct (D) or anti-Nt (E) of native Cav1.2 from the same sample of surface-biotinylated cortical slices. (F–I) Channel activity-dependent regulation of mid-channel proteolysis. Left: representative Western blot with anti-LII–III of Cav1.2 in cortical slices treated with either vehicle (control) or the indicated reagent(s) before surface biotinylation: (F) verapamil (VP, 65 μM, 2 hr); (G) nifedipine (Nif, 10 μM, 2 hr) and CNQX (21.5 μM, 2 hr); (H) ionomycin (Iono, 3 μM, 45 min); (I) BayK8644 (14 μM, 40 min) and 65 mM KCl (40 min). Middle: bar graph depicting the proteolysis index (intensity ratio of 150-kDa/240-kDa band) for the representative gel. Right: summary graph showing data pooled from the indicated number of independent experiments. In this and all subsequent figures, data in bar graphs are represented as mean±s.e.m. and asterisks denote statistical differences, with P<0.01, unless indicated otherwise. See also Figure S5.
Figure 2
Figure 2. Visualization of mid-channel proteolysis of Cav1.2 in the plasma membrane of cultured hippocampal neurons
(A) Western blot with the indicated antibodies of native Cav1.2 from the same preparation of surface-biotinylated neurons. (B) Confocal images of a representative dendritic segment of a neuron expressing LGH3. Left: surface and intracellular LGH3 indicated by GFP. Middle: surface LGH3 indicated by anti-HA+Alexa594 secondary antibodies. Right: overlay. Exemplar clusters of red/green colocalization and non-colocalization are marked by yellow and white arrows, respectively. Scale bar: 5 μm. (C) Fluorescence intensity profile (bottom) of another dendritic segment (top). Exemplar clusters of red/green colocalization and non-colocalization are marked by * and **, respectively. (D) Quantification of red/green colocalization in two dendritic segments displaying visually different extents of mid-channel proteolysis. Left and middle: images of GFP (lane 1), HA-Alexa594 (lane 2), overlay (lane 3) and the “voxels” selected according to our analysis protocol (lane 4). Right: cumulative distribution of the non-colocalization index (NCI) for the two selected dendritic segments. Scale bar: 10 μm. (E) Ensemble cumulative distribution of NCI from the dendrites of neurons expressing LGH3 randomly divided into two groups (n=15 each, same culture). (F) Ensemble cumulative distribution of NCI from the dendrites of neurons expressing LGH1 (n=23), LGH2 (n=15) and LGH3 (n=13). All experiments were performed in parallel. The three distributions were significantly different. See also Figures S1 and S2.
Figure 3
Figure 3. Signaling pathways and molecular determinants of Cav1.2 mid-channel proteolysis
(A) Role of calpain. Left: representative Western blot with anti-LII–III in hippocampal neurons treated, before surface biotinylation, with a cocktail of calpain inhibitors (200 nM calpeptin, 1 μM ALLN, and 270 nM calpain inhibitor III) for 80 min at 37°C. Middle: proteolysis index for the representative gel. Right: summary graph showing data pooled from 4 independent experiments. P<0.05. (B) Ensemble cumulative distribution of NCI from the dendrites of neurons expressing LGH3 treated with DMSO (control, n=24) or calpain inhibitors (n=19). (C) Ensemble cumulative distribution of NCI from the dendrites of neurons expressing LGH3 (n=13) treated with DMSO (control) or a cocktail of MG-132 (7 μM) and ubiquitin aldehyde (1 μM) for 75 min at 37°C. (D) Ensemble cumulative distribution of NCI from the dendrites of neurons expressing LGH3 (n=16) or LGH3_PY/AA (n=17), where residues P1364 and Y1365 of LGH3 were mutated to alanine. (E) Schematic domain topology of LGH3, marking the positions and amino acid sequences of the PEST1 site, the PEST3 site, and the PY motif. (F) Ensemble cumulative distribution of NCI from the dendrites of neurons expressing LGH3 (n=19) or LGH3_ΔPEST3 (n=17), where residues H840-R861 of LGH3 were deleted. (G) Ensemble cumulative distribution of NCI from the dendrites of neurons expressing LGH3 (n=19) or LGH3_ΔPEST1 (n=15), where residues D446-D459 of LGH3 were deleted. Representative dendrites are shown in Figure S3C. In (B–D), (F) and (G), all experiments in each panel were performed in parallel, and the two distributions were significantly different. See also Figure S3.
Figure 4
Figure 4. Channel activity-dependent regulation of Cav1.2 mid-channel proteolysis and Ca2+ channel currents in cultured hippocampal neurons
(A and C) Ensemble cumulative distribution of NCI from the dendrites of neurons expressing LGH3. Neurons were treated for 30 min with DMSO (control), DMSO and 65 mM KCl, or 1.4 μM BayK8644 and 65 mM KCl (n=13 for all) in (A); or with DMSO (control) (n=19), DMSO and 65 mM KCl (n=14), or 20 μM nifedipine and 65 mM KCl (n=18) in (C). Representative dendrites for each condition are shown in Figure S4A. All experiments in each panel were performed in parallel. In (A), the two treated groups were significantly different from control but not from each other; in (C), all three distributions were significantly different. The same results were obtained from two other independent cultures. (B and D) Channel activity-dependent regulation of mid-channel proteolysis. Left: representative Western blot with anti-LII–III in neurons treated (1hr) with DMSO (ctl) or BayK8644 (1.4 μM) (B), or nifedipine (10 μM) (D), before surface biotinylation. Middle: proteolysis index for the representative gel. Right: summary graph showing data pooled from the indicated number of independent experiments. (E and F) Whole-cell Ca2+ channel currents from neurons blindly treated for 30 min with DMSO (ctl), or 65 mM KCl and 1.4 μM BayK8644 (E), or 10 μM nifedipine (F). Left: representative family of currents recorded from the indicated neuron. Right: summary graph of the maximal current density for the indicated group of neurons. Number of blind recordings is indicated above the bar. P<0.05. See also Figure S4.
Figure 5
Figure 5. Functional effect of mid-channel cleavage at an engineered site on Ca2+ channel currents and properties
(A) Schematic of LGH3_TEVp, which contains a TEVp cutting site (yellow circle) in the II–III loop between D815 and G816, upstream of the anti-LII–III epitope T821-S838. (B) Whole-cell currents (top) recorded at −10 mV from oocytes expressing the indicated constructs (middle). Currents were normalized to the mean value of the left-most control group. Number of measurements indicated above the bar. Bottom: Western blot with anti-LII–III of surface-biotinylated oocytes from the exact same groups. (C) Voltage-dependence of activation of currents recorded from inside-out macropatches excised from oocytes expressing Cav2.1_TEVp or WT Cav2.1, before (top) or after (bottom) bath application of 100 μM purified TEVp or TEVp(C151A). Standard error is smaller than the symbols (n=7–10). See also Figure S6A.
Figure 6
Figure 6. Functional properties and effects of fragment-channels
(A) Schematic of three possible cuts (scissors) of Cav1.2 and three pairs of recombinant complementary fragment-channels. (B and C) Whole-cell currents recorded at −10 mV from oocytes expressing the indicated recombinant fragment-channels (B) or proper pairs (C). (D and E) Current-voltage relationship (D) and voltage-dependence of inactivation (E) of currents recorded from oocytes expressing the indicated constructs. Standard error is smaller than the symbols (n=6–18). (F) Whole-cell currents recorded at −10 mV from oocytes expressing full-length Cav1.2, with or without the indicated recombinant fragment-channel coexpressed. (G–L) Current-voltage (I–V) relationship (G, I, and K) and voltage-dependence of inactivation (H, J, and L) of currents recorded from oocytes expressing the indicated Cav1.2 constructs. Standard error is smaller than the symbols (n=3 for (L) and n=6–14 for other panels). The effect of C2 could not be assessed because the whole-cell current in those experiments was too small to allow accurate measurements (see (F), right-most bar). See also Figure S6B.
Figure 7
Figure 7. Mid-channel proteolysis is age-dependent and can be reversed by a L-type VGCC blocker in vivo
(A) Progressive increase of mid-channel proteolysis with age. Left: representative Western blot with anti-LII–III of native Cav1.2 in surface-biotinylated rat cortical slices from the indicated age groups. Middle: proteolysis index for the representative gel. Right: summary graph showing data pooled from the indicated number of independent experiments. Every independent experiment consisted of parallel dissections of the age groups involved (see Experimental Procedures). (B) Reduction of mid-channel proteolysis by oral administration of verapamil. Left: representative Western blot with anti-LII–III of native Cav1.2 in surface-biotinylated cortical slices from 16-month old rats fed with water, or water medicated with 12.5 mg per day of verapamil for 3–5 weeks. Middle: proteolysis index for the representative gel. Right: summary graph showing data pooled from five independent experiments. See also Figure S7.

Comment in

References

    1. Altier C, Garcia-Caballero A, Simms B, You H, Chen L, Walcher J, Tedford HW, Hermosilla T, Zamponi GW. The Cavβ subunit prevents RFP2-mediated ubiquitination and proteasomal degradation of L-type channels. Nat Neurosci. 2011;14:173–180. - PubMed
    1. Blanpied TA, Scott DB, Ehlers MD. Dynamics and regulation of clathrin coats at specialized endocytic zones of dendrites and spines. Neuron. 2002;36:435–449. - PubMed
    1. Brawley RM, Hosey MM. Identification of two distinct proteins that are immunologically related to the α1 subunit of the skeletal muscle dihydropyridine-sensitive calcium channel. J Biol Chem. 1992;267:18218–18223. - PubMed
    1. Cain SM, Snutch TP. Voltage-gated calcium channels and disease. Biofactors. 2011;37:197–205. - PubMed
    1. Catalucci D, Zhang DH, DeSantiago J, Aimond F, Barbara G, Chemin J, Bonci D, Picht E, Rusconi F, Dalton ND, et al. Akt regulates L-type Ca2+ channel activity by modulating Cavα1 protein stability. J Cell Biol. 2009;184:923–933. - PMC - PubMed

Publication types