. 2014 Jun 9:5:4039.
doi: 10.1038/ncomms5039.

Recurrent somatic mutation in DROSHA induces microRNA profile changes in Wilms tumour

Affiliations
Free PMC article

Recurrent somatic mutation in DROSHA induces microRNA profile changes in Wilms tumour

Giovana T Torrezan et al. Nat Commun. .
Free PMC article

Abstract

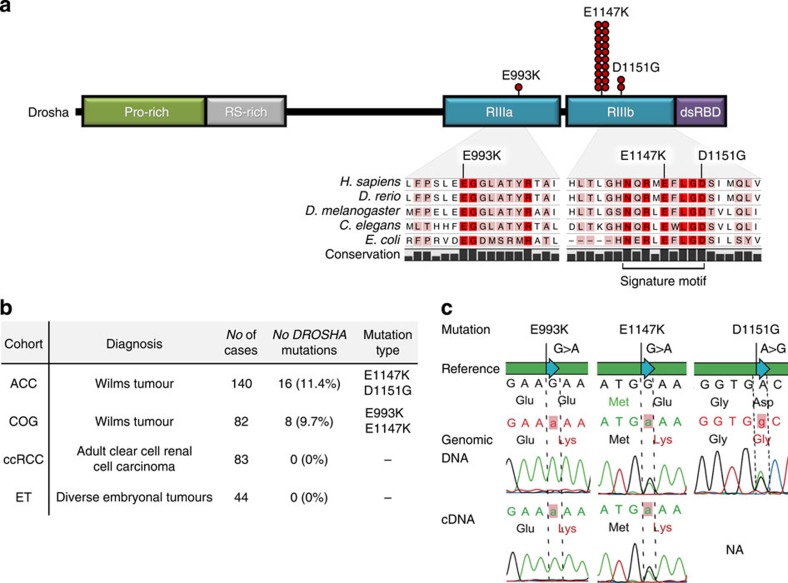
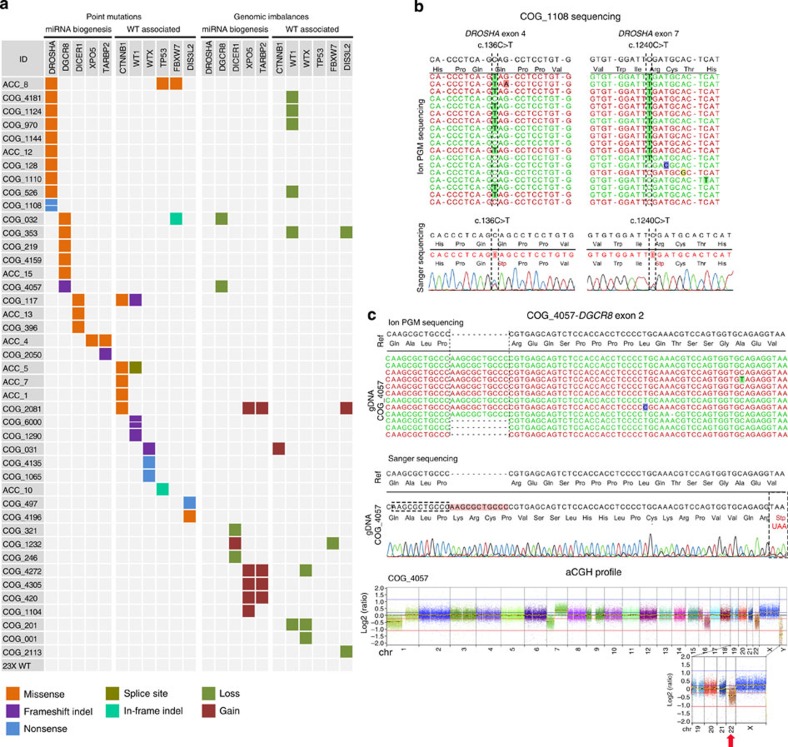
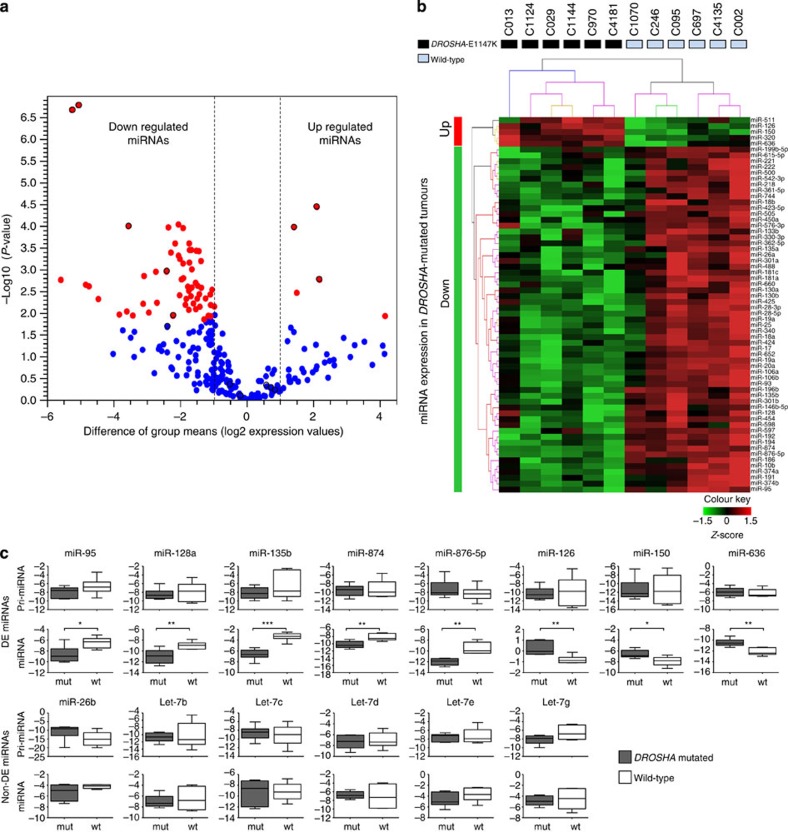
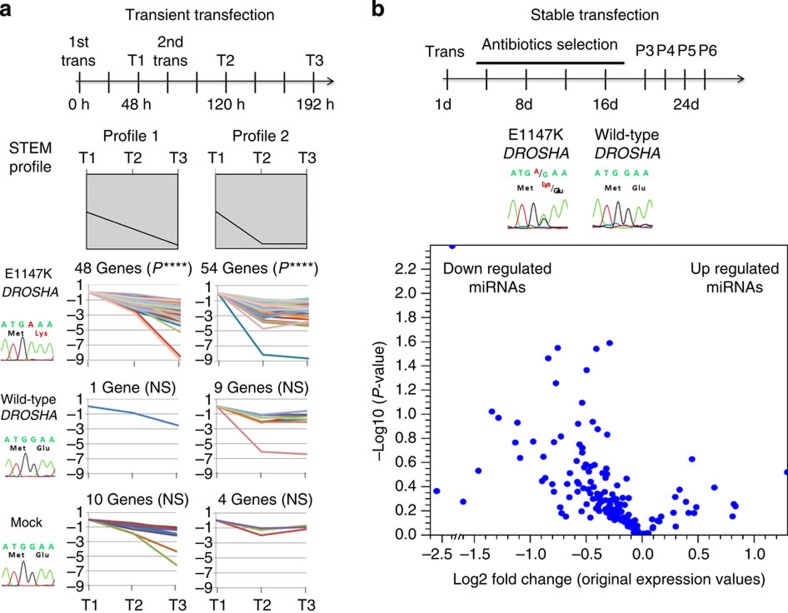
Wilms tumour (WT) is an embryonal kidney neoplasia for which very few driver genes have been identified. Here we identify DROSHA mutations in 12% of WT samples (26/222) using whole-exome sequencing and targeted sequencing of 10 microRNA (miRNA)-processing genes. A recurrent mutation (E1147K) affecting a metal-binding residue of the RNase IIIb domain is detected in 81% of the DROSHA-mutated tumours. In addition, we identify non-recurrent mutations in other genes of this pathway (DGCR8, DICER1, XPO5 and TARBP2). By assessing the miRNA expression pattern of the DROSHA-E1147K-mutated tumours and cell lines expressing this mutation, we determine that this variant leads to a predominant downregulation of a subset of miRNAs. We confirm that the downregulation occurs exclusively in mature miRNAs and not in primary miRNA transcripts, suggesting that the DROSHA E1147K mutation affects processing of primary miRNAs. Our data underscore the pivotal role of the miRNA biogenesis pathway in WT tumorigenesis, particularly the major miRNA-processing gene DROSHA.


Figures

Figure 1
Figure 1. DROSHA mutations identified in WTs.
(a) Schematic representation of the Drosha protein, showing the position of the three identified mutations in the catalytic RNase III domains (RIIIa and RIIIb). Red circles denote the absolute frequency of each mutation in the entire WT cohort (222 patients). In the magnified region, the missense mutations E993K (RIIIa), E1147K (RIIIb) and D1151G (RIIIb) are shown in the context of RNase III domain conservation across several species; conserved residues are shaded in pink (80% conservation), while invariant residues are in red. The lower bar represents the 9-amino-acid signature motif of RNase III proteins. Domain abbreviations: Pro-rich, proline-rich region; RS-rich, serine/arginine-rich region; RIIIa, RNase IIIa domain; RIIIb, RNase IIIb domain; dsRBD, double-stranded RNA-binding domain. (b) Frequency of DROSHA mutations (RIIIa and/or RIIIb domains) in the four series of tumours. We investigated two independent WT cohorts (140 from A. C. Camargo (ACC) (including the index case) and 82 from the Children’s Oncology Group (COG)), a group of 83 adult clear-cell renal cell carcinomas (ccRCC), and 44 embryonal tumours from different organs (ET). Mutations in the RIIIa and RIIIb domains of DROSHA were detected in ~11% (24/222) of WTs. (c) Sequence traces from DNA (top panels) and cDNA (bottom panels) of DROSHA-mutated WTs. All tumours harbouring either the E1147K (n=21) or D1151G (n=2) mutation presented the variant in a heterozygous state (DNA and/or RNA data); by contrast, the E993K alteration, which was detected in only one patient, was a homozygous mutation (both tumour DNA and RNA samples). NA, RNA not available.
Figure 2
Figure 2. Mutation spectrum of WTs.
(a) Mutations of the miRNA core processing genes (miRNA biogenesis) and WT-associated genes (WT associated) in 66 fresh-frozen WT samples. Only the genes that were affected by point mutations in at least one sample are shown. Point mutations and indels (left panels) were identified by targeted parallel sequencing, and genomic imbalances (right panels) were detected by aCGH. aCGH data were obtained for 53 samples (2 from ACC and 51 from COG) from a previous study of the group. The coloured squares refer to the corresponding type of point mutation (missense, splice site, frameshift indel, in-frame indel and nonsense) or genomic imbalance (loss and gain). A detailed description of each mutation is provided in Table 1; Supplementary Tables 4 and 5. (b) DROSHA nonsense mutations (c.136C>T; p.Q46* and c.1240C>T; p.R414*) identified in a single patient (COG_1108) by targeted parallel sequencing (upper panels) and validated by capillary Sanger sequencing (bottom panels). (c) Mutations identified in the DGCR8 gene. The first panel depicts the 11-nt frameshift duplication identified by targeted parallel sequencing. The middle panel presents the validation by capillary sequencing and the translation of the mutated allele, highlighting the formation of a premature stop codon 62 nt downstream of the alteration. This patient (COG_4057) also presented a heterozygous loss of the entire chromosome 22 (aCGH profile—bottom panel), leading to the deletion of the wild-type DGCR8 allele. Owing to tumour heterogeneity and/or normal cell contamination, this aneuploidy is present in mosaic, resulting in ~30% of reads from Ion Torrent sequencing displaying the wild-type allele and in a log2 ratio value of −0.4 in aCGH analysis.
Figure 3
Figure 3. Comparison of miRNA expression levels of six DROSHA-E1147K-mutated and six wild-type WT samples.
The samples used in this analysis were fresh-frozen tumours from COG from patients that were not subjected to neoadjuvant chemotherapy. Panels a and b refer to the TaqMan Array miRNA profiling experiment. Panel c refers to the individual TaqMan assays. (a) Volcano plot showing a predominant reduction in mature miRNAs in DROSHA-E1147K tumours. The x axis represents the difference of group means (log2 expression values) of DROSHA-mutated and wild-type tumours; the y axis represents the statistical significance (−log10 P-values). Each miRNA is represented by a dot, and red dots represent those miRNAs that were differentially expressed between the groups; red dots with black borders were selected for pri-miRNA/mature miRNA validation (Fig. 3c). A total of 64 out of 249 miRNAs were differentially expressed between mutated and non-mutated samples. Downregulated miRNAs were over-represented, as 59 miRNAs were downregulated and only 5 were upregulated (Supplementary Table 8). (b) Unsupervised hierarchical clustering analysis based on expression data for the 64 differentially expressed miRNAs confidently discriminated DROSHA-E1147K from non-mutated samples. (c) Primary and mature miRNA expression. The expression of primary and mature miRNA pairs of eight differentially expressed (DE) and six non-differentially expressed controls (non-DE) was assessed by TaqMan individual assays of the same 12 samples from the array platform. Mean values and s.d. of experiments are shown; statistical significance was calculated using the t-test (*P≤0.01; **P≤0.001; ***P≤0.0001). While all eight DE mature miRNAs were validated as differentially expressed between the DROSHA-mutated and wild-type groups (bottom diagrams), none of the eight DE pri-miRNAs exhibited any significant difference in expression (top diagrams). For the six control miRNAs, no difference in expression level was observed in both mature and pri-miRNAs between the groups (fold changes and P-values are presented in Supplementary Table 9). These results confirm that the differences in mature miRNA expression levels resulted from impaired Drosha activity.
Figure 4
Figure 4. miRNA profile in cell line models expressing E1147K Drosha.
(a) Time course experiment of miRNA expression in HEK293 cells transiently expressing wild-type or E1147K Drosha. A schematic representation of the experiment is depicted in the top panel: transfections were performed twice in a 72-h interval (1st trans and 2nd trans), and miRNA expression levels were measured at three time points using the TaqMan Array platform (T1, T2 and T3). The middle panel represents the Short Time-series Expression Miner (STEM) analysis profiles, which were used to cluster and analyse the expression data. Of the six considered profiles produced by STEM analysis (Supplementary Fig. 6), E1147K-transfected cells presented two statistically significant profiles—(profile 1: P=2 × 10⁻¹⁶; and profile 2: P=2 × 10⁻⁸) that harboured more genes than expected by chance (48 and 54 genes, respectively). These two profiles represent a reduction in mature miRNA levels from time points T1 to T3. ****P≤0.00001. NS, not significant. (b) miRNA expression in HEK293T cells stably transfected with wild-type or E1147K Drosha. The top panel depicts a schematic representation of the experiment, showing the time length of selection and the passages at which cell extracts were collected for miRNA expression analysis. Four passages of each stable cell line were evaluated for miRNA expression using the TaqMan Array platform, and the mean expression values of each miRNA in E1147K and wild-type cells were compared. The middle panel presents the cDNA sequencing traces, which demonstrate that stable transfection resulted in similar expression levels of the mutant and endogenous wild-type alleles. The lower panel displays a volcano plot showing a trend to preferential reduction in mature miRNAs in E1147K-stably transfected cells, characterized by the enrichment of miRNAs species in the left side of the volcano plot. The x axis represents the log2 fold change between HEK293T-E1147K and wild-type cells; the y axis represents the statistical significance (−log10 P-values).

References

    1. Honeyman J. N. et al.. Factors associated with relapse and survival in Wilms tumor: a multivariate analysis. J. Pediatr. Surg. 47, 1228–1233 (2012). - PubMed
    1. Reinhard H. et al.. Outcome of relapses of nephroblastoma in patients registered in the SIOP/GPOH trials and studies. Oncol. Rep. 20, 463–467 (2008). - PubMed
    1. Coppes M. J., Haber D. A. & Grundy P. E. Genetic events in the development of Wilms’ tumor. New Engl. J. Med. 331, 586–590 (1994). - PubMed
    1. Huff V. Wilms tumours: about tumour suppressor genes, an oncogene and a chameleon gene. Nat. Rev. Cancer 11, 111–121 (2011). - PMC - PubMed
    1. Call K. M. et al.. Isolation and characterization of a zinc finger polypeptide gene at the human chromosome 11 Wilms’ tumor locus. Cell 60, 509–520 (1990). - PubMed

Publication types