

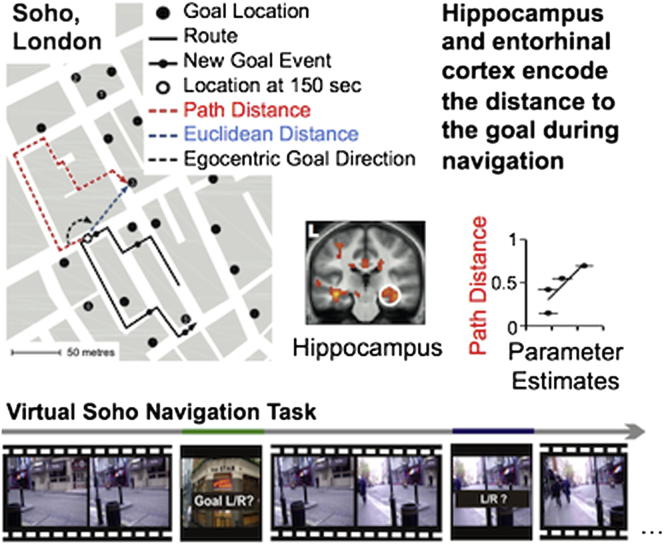
The hippocampus and entorhinal cortex encode the path and Euclidean distances to goals during navigation
- PMID: 24909328
- PMCID: PMC4062938
- DOI: 10.1016/j.cub.2014.05.001
The hippocampus and entorhinal cortex encode the path and Euclidean distances to goals during navigation
Abstract
Background: Despite decades of research on spatial memory, we know surprisingly little about how the brain guides navigation to goals. While some models argue that vectors are represented for navigational guidance, other models postulate that the future path is computed. Although the hippocampal formation has been implicated in processing spatial goal information, it remains unclear whether this region processes path- or vector-related information.
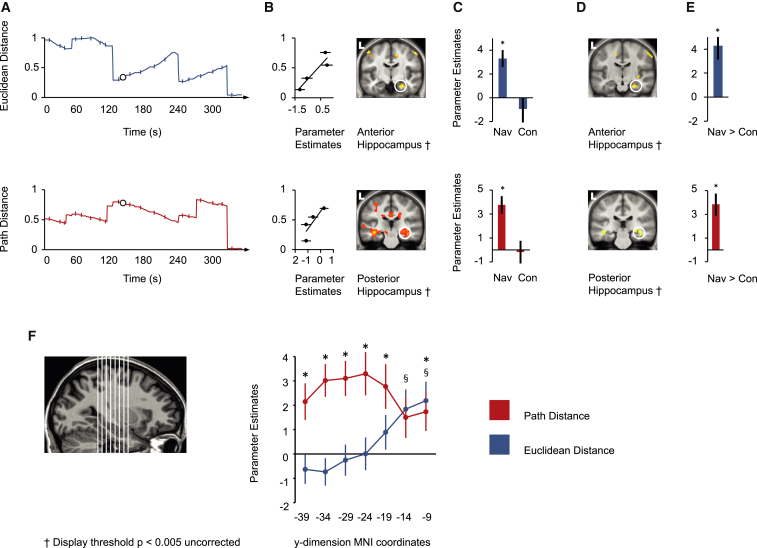
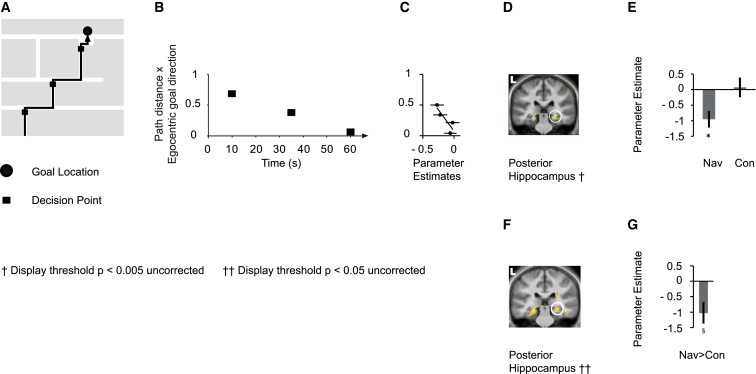
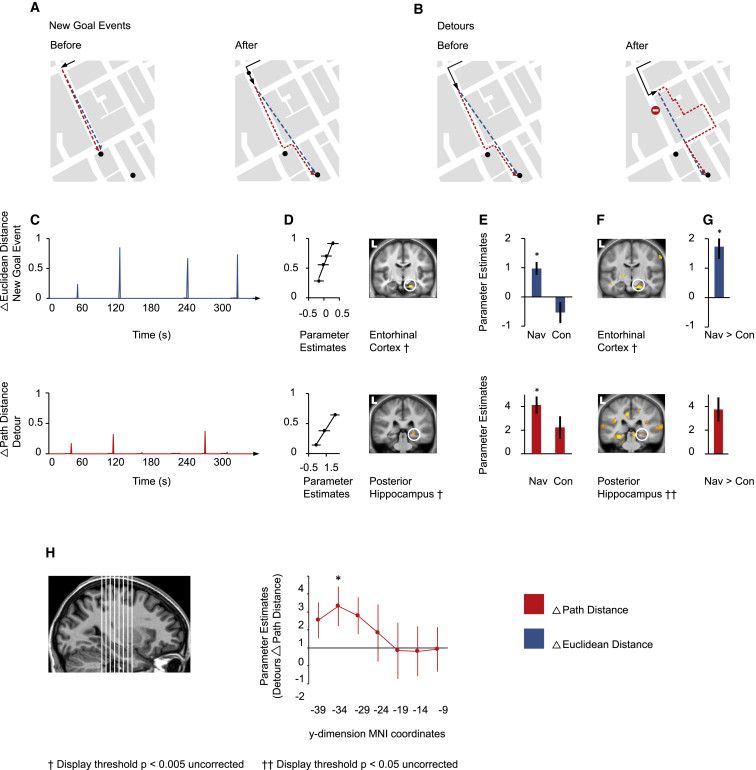
Results: We report neuroimaging data collected from subjects navigating London's Soho district; these data reveal that both the path distance and the Euclidean distance to the goal are encoded by the medial temporal lobe during navigation. While activity in the posterior hippocampus was sensitive to the distance along the path, activity in the entorhinal cortex was correlated with the Euclidean distance component of a vector to the goal. During travel periods, posterior hippocampal activity increased as the path to the goal became longer, but at decision points, activity in this region increased as the path to the goal became closer and more direct. Importantly, sensitivity to the distance was abolished in these brain areas when travel was guided by external cues.
Conclusions: The results indicate that the hippocampal formation contains representations of both the Euclidean distance and the path distance to goals during navigation. These findings argue that the hippocampal formation houses a flexible guidance system that changes how it represents distance to the goal depending on the fluctuating demands of navigation.
Copyright © 2014 The Authors. Published by Elsevier Inc. All rights reserved.
Figures
References
-
- Hafting T., Fyhn M., Molden S., Moser M.-B., Moser E.I. Microstructure of a spatial map in the entorhinal cortex. Nature. 2005;436:801–806. - PubMed
-
- O’Keefe J., Nadel L. Oxford University Press; Oxford: 1978. The Hippocampus as a Cognitive Map.
-
- Hartley T., Maguire E.A., Spiers H.J., Burgess N. The well-worn route and the path less traveled: distinct neural bases of route following and wayfinding in humans. Neuron. 2003;37:877–888. - PubMed
Publication types
MeSH terms
Grants and funding
LinkOut - more resources
Full Text Sources
Other Literature Sources
