. 2014 Jun 16;25(6):809-821.
doi: 10.1016/j.ccr.2014.04.026. Epub 2014 Jun 5.

B cells regulate macrophage phenotype and response to chemotherapy in squamous carcinomas

Affiliations

B cells regulate macrophage phenotype and response to chemotherapy in squamous carcinomas

Nesrine I Affara et al. Cancer Cell. .

Abstract

B cells foster squamous cell carcinoma (SCC) development through deposition of immunoglobulin-containing immune complexes in premalignant tissue and Fcγ receptor-dependent activation of myeloid cells. Because human SCCs of the vulva and head and neck exhibited hallmarks of B cell infiltration, we examined B cell-deficient mice and found reduced support for SCC growth. Although ineffective as a single agent, treatment of mice bearing preexisting SCCs with B cell-depleting αCD20 monoclonal antibodies improved response to platinum- and Taxol-based chemotherapy. Improved chemoresponsiveness was dependent on altered chemokine expression by macrophages that promoted tumor infiltration of activated CD8(+) lymphocytes via CCR5-dependent mechanisms. These data reveal that B cells, and the downstream myeloid-based pathways they regulate, represent tractable targets for anticancer therapy in select tumors.


Figures

Figure 1
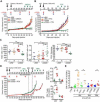
Figure 1. CD20 and Ig mRNA expression in human cancers
Relative CD20 (A) and Ig (B) mRNA expression in a panel of human cancers. Data are represented as box-and-whisker plots depicting median fold change value compared to normal tissue, displaying the first and third quartiles at the end of each box, with the maximum and minimum at the ends of the whiskers. Number of human cancer tissue / number of normal tissue is shown for each organ. Shown are tissues with statistically significant differences between cancer tissue and control normal tissue, with significance determined via Wilcoxon rank-sum test with *p < 0.05, **p < 0.01, ***p < 0.001. (C) Representative histology of skin, vulva, and head and neck SCC in comparison to normal skin tissue. From left to right are (i) H&E, (ii) IHC staining for CD45+ leukocytes, (iii) CD20+ B cells, and CD8+ T cells. (D) Density of CD45+, CD20+ and CD8+ cells as determined by automated counting of IHC stained sections. Ca, carcinoma; HNSCC, head and neck squamous carcinoma; SCC, squamous cell carcinoma. See Fig. S1 for complete analysis.
Figure 2
Figure 2. Inhibited neoplastic progression in K14-HPV16 mice by therapeutic αCD20 mAb or fostamatinib
(A) Two stages of squamous carcinogenesis were evaluated: (i) K14-HPV16 mice were enrolled at 1 month of age and received αCD20 or isotype control αRW at a 2-week interval until mice were 4 months of age (Prevention), and (ii) B cell depletion or Syk inhibition was initiated at 3 months of age at a 2-week interval until mice were 6 months of age (Intervention). Fostamatinib (R788), an orally bioavailable Syk kinase inhibitor, was administered through chow ad libitum at 2.0 g/kg/day to HPV16/FcRγ+/− and HPV16/FcRγ−/− mice at 1 month of age as compared to mice receiving control chow until 4 months of age. (B) Percentages of ear skin (area) exhibiting dysplasia by 4 or 6 months of age following αCD20 mAb or fostamatinib administration. Values represent percentages of dysplastic lesions compared to whole ear skin per mouse with 5-10 mice per experimental group. Results shown represent mean ± SEM. Representative H&E sections from the αCD20 mAb intervention study are shown to the right. Scale bars are at 50 μm. (C) Percentages of CD45+ immune cells in single cell suspensions of skin as assessed by flow cytometry. Results shown represent mean ± SEM. (D) Immune cell lineage analysis by flow cytometry as percentages of total CD45+ leukocyte infiltrates in ear tissue. (E) Angiogenic vasculature in skin of cohorts as evaluated by CD31/PECAM-1 IHC. Values represent average of five high-power fields of view (FOV) per mouse. (F) Keratinocyte proliferation in skin of mice cohorts as assessed by automated counting of bromodeoxyuridine (BrdU)-positive keratinocytes per mm2 of premalignant tissue. Data reflects ≥ 3 mice per group with statistical significance determined via an unpaired t-test with *p < 0.05, **p < 0.01, ***p < 0.001. See also Fig. S2.
Figure 3
Figure 3. B cell-deficient mice limit SCC tumor growth
Growth of (A) PDSC5 (clone 6; PDSC5.6) and (B) WDSC1 tumor cells injected orthotopically into syngeneic JH+/+ (red), JH+/− (blue), and JH−/− (green) mice. (*) denotes statistically significant differences in tumor growth between JH+/− and JH−/− mice. One of two representative experiments is shown and depicted as mean ± SEM (>10 mice per group). Representative H&E sections are shown to the right. Scale bars are at 50 μm. (C) Growth of PDSC5.6-derived tumors in syngeneic mice treated with αCD20 (red) or αRW (blue) mAb either at the time of PDCS5.6 tumor cell inoculation (d0) with 2-week interval dosing (d0, q14d), or alternatively in mice that received αCD20 mAb (green) following appearance of visible tumors (d12, q14d). (*) indicates statistically significant differences between tumor growth in mice receiving αCD20 at d12 compared to αCD20 or αRW at d0. One of two representative experiments is shown depicted as mean ± SEM (≥10 mice per group). (D) Infiltration of CD8+ T lymphocytes within tumors from (C) as assessed by flow cytometry (left panel) and IHC (right panel). Unless otherwise indicated, statistical significance was determined via an unpaired t-test with *p < 0.05, **p < 0.01. See also Fig. S3.
Figure 4
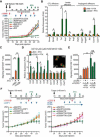
Figure 4. B cell depletion sensitizes established tumors to cytotoxic agents
(A-B) Growth of PDSC5.6 SCCs in syngeneic mice receiving αCD20 or αRW mAbs at the time of visible tumor appearance (d10), followed 3 weeks later by administration of the platinum-containing chemotherapeutic agents (A) carboplatin (CBDCA; 50 mg/kg; q4dx3) (5-10 mice per group), or (B) paclitaxel (PTX; 12 mg/kg; q4dx3), with ≥10 mice per group. One of at least two representative experiments is shown depicted as mean ± SEM with (*) indicating statistically significant differences in tumor growth between αCD20 mAb/CTX, as compared to αCD20 mAb alone. (C) Analysis of tissue sections from PDSC5.6 SCCs for (c): tumor cell proliferation, apoptosis and vascular density by either automated quantitation of BrdU+, caspase-3+ cells, or manual counting of CD31+ structures in five high-power fields of view per mouse. (D) Growth of PDSC5.6 SCCs in mice receiving multiple cycles of therapy (as shown) (≥17 mice per group). Results shown represent mean ± SEM. Presence of CD8+ and CD4+ T cells in PDSC5.6-derived SCCs, determined by flow cytometry, as percent of total CD45+ leukocytes within tumors at day 43 (stasis) and day 49 (regrowth) shown graphically on right. (E) Infiltration of CD8+ T lymphocytes into premalignant skin from 4-mo old K14-HPV16/B cell-deficient, K14-HPV16/FcRγ-deficient, and K14-HPV16 mice enrolled in the Intervention trial with αCD20 mAbs as assessed by flow cytometry as a percentage of CD45+ cells (5-17 mice per group). Unless otherwise indicated, statistical significance was determined via an unpaired t-test with *p < 0.05, **p < 0.01, ***p < 0.001. See also Fig. S4.
Figure 5
Figure 5. Combination αCD20 mAb plus chemotherapy inhibits SCC tumor growth by CD8+ T cell-dependent mechanisms
(A) Tumor growth of PDSC5.6-derived SCCs in mice treated with αCD20 mAb, or αCD8 (clone YTS169.4; 500 μg) depleting mAb, alone or in combination with PTX, as depicted by treatment regimen. One of two representative experiments is shown and depicted as mean ± SEM. (*) indicates statistically significant differences in tumor growth between αCD20/PTX-treated mice compared to mice receiving αCD20 mAb alone (5-10 mice per group). (B) mRNA expression of PDSC5.6 SCCs from PBS-perfused αCD20/PTX-treated mice compared to mice receiving αRW/PTX at d45 of treatment regimen. (C) Ex vivo recruitment of purified splenic CD8+ T lymphocytes in response to conditioned medium derived from FACS-sorted tumor-associated macrophages (CD11b+Ly6CLy6GF4/80+MHCII+) isolated from PDSC5.6 SCCs of αCD20/PTX versus αRW/PTX-treated mice assessed using a Boyden chamber assay. Data are representative of 2 independent experiments. (D) Cytokine mRNA expression of FACS-sorted macrophages (CD11b+Ly6CLy6GF4/80+MHCII+) isolated from PDSC5.6-derived SCCs from αCD20/PTX versus αRW/PTX-treated mice at d45 of treatment regimen. Inset shows representative confocal microscopy showing morphology of sorted macrophages visualized by β-actin (green) and DAPI (red) staining. Data represent mean fold change ± SEM in expression compared to αRW/PTX treatment group (n=8 per group). (E) Ex vivo chemotaxis of purified splenic CD8+ T lymphocytes in response to conditioned medium derived from FACS-sorted macrophages (CD11b+Ly6CLy6GF4/80+MHCII+) isolated from PDSC5.6 SCCs in αCD20/PTX versus αRW/PTX-treated mice assessed in the presence or absence of blocking antibodies against CCR5 (10 μg/ml) or CXCR3 (10 μg/ml). Samples were assayed in triplicates for each tested condition with pooled samples from 10 tumors. Data are displayed as mean ± SEM. Statistical significance for b-e was determined via an unpaired t-test with *p < 0.05, **p < 0.01, ***p < 0.001. (F) Relative orthotopic growth of PDSC5.6 SCCs in syngeneic mice following administration of PTX in mice pre-treated with αCD20 mAb, αCD8 depleting mAb (clone YTS169.4), αCSF1 neutralizing mAb (clone 5A1), or the CCR5 inhibitor maraviroc (CCR5i) as depicted by treatment regimen shown. Data represent mean ± 95% SEM. (*) indicates statistically significant differences in tumor growth between αCD20/PTX-treated mice as compared to all other groups as determined by two-way ANOVA (>8 mice per group). See also Fig. S5.
Figure 6
Figure 6. B cell depletion repolarizes tumor-associated macrophages in SCC
Cartoon showing a putative model for improved chemotherapeutic responses in SCCs following B cell depletion. Left: During tumor development, autoantibody production by B cells leads to deposition of immune complexes (IC) within neoplastic tissue. Signaling of these complexes through activating FcγR activates several protumor pathways, including angiogenic, tissue remodeling and pro-survival pathways in mast cells and TH2-tumor-associated macrophages (TAMs). Right: αCD20 mAb therapy reduces presence of B cells and Ig, the absence of which fosters development of TAMs that instead express increased levels of angiostatic (CXCL10, 11), and CCR chemokines that enhance CD8+ T cell infiltration of malignant tumors culminating in improved response to chemotherapy. Tumor growth to end-stage is thereby significantly slowed by enhanced cytotoxic effects on tumor cells and indirectly through effects on vasculature.

References

    1. Albers A, Abe K, Hunt J, Wang J, Lopez-Albaitero A, Schaefer C, Gooding W, Whiteside TL, Ferrone S, DeLeo A, Ferris RL. Antitumor activity of human papillomavirus type 16 E7-specific T cells against virally infected squamous cell carcinoma of the head and neck. Cancer Res. 2005;65:11146–11155. - PubMed
    1. Ammirante M, Luo JL, Grivennikov S, Dedospasov S, Karin M. B-cell-derived lymphotoxin promotes castration-resistant prostate cancer. Nature. 2010;464:302–306. - PMC - PubMed
    1. Andreu P, Johansson M, Affara NI, Pucci F, Tan T, Junankar S, Korets L, Lam J, Tawfik D, DeNardo DG, et al. FcRgamma activation regulates inflammation-associated squamous carcinogenesis. Cancer Cell. 2010;17:121–134. - PMC - PubMed
    1. Arbeit JM, Munger K, Howley PM, Hanahan D. Progressive squamous epithelial neoplasia in K14-human papillomavirus type 16 transgenic mice. J Virol. 1994;68:4358–4368. - PMC - PubMed
    1. Arbeit JM, Olson DC, Hanahan D. Upregulation of fibroblast growth factors and their receptors during multi-stage epidermal carcinogenesis in K14-HPV16 transgenic mice. Oncogene. 1996;13:1847–1857. - PubMed

Publication types

MeSH terms