. 2014 Aug 21;512(7514):270-5.
doi: 10.1038/nature13293. Epub 2014 Jun 8.

Crystal structure of a human GABAA receptor

Affiliations

Crystal structure of a human GABAA receptor

Paul S Miller et al. Nature. .

Abstract

Type-A γ-aminobutyric acid receptors (GABAARs) are the principal mediators of rapid inhibitory synaptic transmission in the human brain. A decline in GABAAR signalling triggers hyperactive neurological disorders such as insomnia, anxiety and epilepsy. Here we present the first three-dimensional structure of a GABAAR, the human β3 homopentamer, at 3 Å resolution. This structure reveals architectural elements unique to eukaryotic Cys-loop receptors, explains the mechanistic consequences of multiple human disease mutations and shows an unexpected structural role for a conserved N-linked glycan. The receptor was crystallized bound to a previously unknown agonist, benzamidine, opening a new avenue for the rational design of GABAAR modulators. The channel region forms a closed gate at the base of the pore, representative of a desensitized state. These results offer new insights into the signalling mechanisms of pentameric ligand-gated ion channels and enhance current understanding of GABAergic neurotransmission.


Figures

Extended Data Figure 1
Extended Data Figure 1. Ligand binding to GABAAR-β3cryst in detergent micelles and in HEK293T cells
a, Overlays of size-exclusion profiles for equal amounts of purified GABAAR-β3cryst that were pre-heated at different temperatures for 1 hour in order to evaluate protein stability. b, Overlays of size-exclusion profiles of purified GABAAR-β3cryst heated at 66 °C (70 % decay temperature) for 1 hour in the presence of increasing doses of histamine. Histamine binding protects (stabilises) the protein in accordance with its affinity, giving a dose-response profile. c, Profiles of GABAAR-β3cryst thermostabilisation in detergent micelles by four ligands. Values in brackets represent the EC50 of thermostabilisation. The assay was used to evaluate two channel blockers, the insecticide fipronil (26 ± 5 nM) and the convulsant picrotoxin (900 ± 480 nM), and two neurotransmitter agonists, GABA (2.3 ± 0.2 mM) and histamine (400 ± 150 μM). NOTE: the GABAAR-β3cryst low sensitivity to GABA is in keeping with that observed for full-length homomeric GABAAR-β3 receptors, which are also less sensitive than αβ and αβγ heteromeric GABAARs. d, e Displacement of bound 1-aminoanthracene (1-AMA) from GABAAR-β3cryst by the anaesthetic etomidate. The fluorescent ligand 1-AMA (5 μM) in the presence of 0.3 μM GABAAR-β3cryst experienced an increase in fluorescence (due to binding in the hydrophobic anaesthetic pocket) that was displaced by increasing concentrations of etomidate; 50 % maximal displacement occurs at 7.1 ± 1.1 μM, n = 5. Peak heights of single traces were measured as the average intensities of peak points between 519 and 533 nm. Equivalent doses of etomidate with the fluorescent ligand 1-AMA (5 μM) in the absence of GABAAR-β3cryst did not displace (reduce) fluorescent signal (not shown). f-g, HEK293T whole-cell patch-clamp recordings of the natural ligand histamine (f) activating an inward current through GABAAR-β3cryst, subsequently blocked by the channel-blocker picrotoxin (fipronil also blocked histamine currents, not shown) and of the anaesthetic propofol activating an inward current through GABAAR-β3cryst (g). All error bars are s.e.m.
Extended Data Figure 2
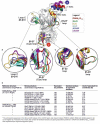
Extended Data Figure 2. Structural alignment of pLGIC extracellular domains and AChBP
The top panel shows structures aligned to the GABAAR-β3cryst ECD, viewed perpendicular to the five-fold pseudo-symmetry axis, from inside the extracellular vestibule. Colour coding: GABAAR-β3cryst in red (PDB 4COF); GluClα in green (PDB 3RIF); ELIC in yellow (PDB 2VL0); GLIC in cyan (PDB 4HFI); AChBP in dark blue (PDB 1UX2); nAChR in violet (PDB 2BG9). Four variable loop regions of functional significance for neurotransmitter binding, signal transduction and receptor assembly have been individually rotated to optimize viewing of the disparities between these structural elements. a, Loop C (β9-β10), capping the neurotransmitter binding site. b, Loop β6-β7 (Cys-loop in eukaryotic structures), important for ECD-TMD coupling and signal transduction. c, Loop β1-β2, important for ECD-TMD coupling and signal transduction. d, Loop β5-β5′, important for subunit assembly at the ECD level. e, Table showing parameters of structural alignment between the GABAAR-β3cryst extracellular (ECD) and transmembrane (TMD) domains, respectively, and equivalent regions in pLGICs as well as the acetylcholine binding protein (AChBP) from Lymnaea stagnalis. Superpositions were performed using the SHP programme (see Methods for details).
Extended Data Figure 3
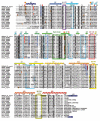
Extended Data Figure 3. Sequence alignment of GABAAR-β3cryst with representative human Cys-loop receptor family members and the other pLGICs crystallized to date (ELIC, GLIC and GluClα)
Residue conservation is indicated by black/grey highlights. Residues involved in inter-subunit salt-bridges are highlighted in red/blue, sites of N-linked glycosylation are highlighted in orange. Sequence block-highlights indicate the classically-defined neurotransmitter-binding loops (A-F, in light cyan), as well as key loops discussed in the manuscript: β1-β2 in purple; β6-β7 (the Cys-loop) in dark green; β8′-β9 loop in light red; M2-M3 loop in yellow; M3-M4 loop in mustard. Dots above the sequence mark residues linked to human diseases (red), binding of anaesthetics (violet), interactions with agonist benzamidine (green) and Tyr299, whose side chain conformation appears to contribute to the control of channel desensitisation (cyan). Orange hexagons indicate N-linked glycans observed in the GABAAR-β3cryst structure. C-terminal residues on dark-blue background represent affinity purification tags. Secondary structure element colouring corresponds to Fig. 1c. The GABAAR-β3cryst residue numbering, shown above the sequence, matches the mature isoform 1 (UniProt entry P28472 Gln26 becoming Gln1). Other sequences are from the following Uniprot entries: GBRB2, P47870; GBRB1, P18505; GLRA1, P23415; GLRB, P48167; GBRA1, P14867; GABRG1, Q8N1C3; ACHA1, P02708-2; ACHB1, P11230; ACHD, Q07001; ACHG, P07510; ACHA7, P36544; 5HT3A, P46098; ELIC, P0C7BY7; GLIC, Q7NDN8. GluClα sequence is from PDB ID: 3RIF. To keep the alignment as compact as possible, the following regions of poor conservation were removed: secretion signal sequences and cytoplasmic M3-M4 loop (as annotated in Uniprot) except for bacterial channels and GluClα; residues 184-192 (GLGPDGQGH) from ACHB1; residues 188-199 (KENRTYPVEWII) from ACHD; residues 187-194 (GQTIEWIF) from ACHG.
Extended Data Figure 4
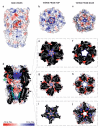
Extended Data Figure 4. Solvent-accessible surfaces of GABAAR-β3cryst coloured by electrostatic potential
a, Outside view of the receptor, perpendicular to the 5-fold pseudo-symmetry axis. The exit point of an ECD side tunnel is indicated by a dotted circle (transversal sections in g-h are at this level). b, View from the extracellular side, along the 5-fold pseudo-symmetry axis. c, View from the intracellular side, along the 5-fold pseudo-symmetry axis. The positively charged region surrounding the central pore originates from the dipoles of the M2 helices. d, Longitudinal cross-section (interior cartoon coloured grey except for pore-lining helices in deep teal), showing electrostatic surface potential inside the pore and in the extracellular vestibule. Arrowheads indicate positions of the transverse cross-sections. A chloride ion bound within the positively charged vestibule belt is shown as a green sphere. The green asterisk marks the exit of a inter-subunit side-tunnel. e, f, Transverse section at level of the neurotransmitter binding site (negatively charged), observed from above and underneath. g, h, Transverse section at level of the ECD tunnels, negatively charged. i, j, Transverse section at level of the anaesthetic (etomidate) binding site, positively charged.
Extended Data Figure 5
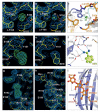
Extended Data Figure 5. Crystallographic quality control for non-protein elements in the GABAAR-β3cryst structure
a-c, The anion binding site between ECD interfaces (corresponding to main text Fig. 2c). a, SigmaA-weighted 2Fo-Fc (blue, contoured at 1.5σ) and Fo-Fc (green/red contoured at +3σ/−3σ) electron density maps following autoBUSTER refinement in the absence of chloride. b, The same electron density maps and contour levels following refinement in the presence of chloride. c, Final model, showing the chloride coordination sphere. d-f, Equivalent panels to the ones described above, for the benzamidine ligand bound to the neurotransmitter pocket. g-i, Equivalent panels to the ones described above, for the N-linked glycan at site 3 (Asn149) except that the contour level of the 2Fo-Fc maps is 1σ. Dotted lines in f and i indicate contacts within hydrogen-bonding distance.
Extended Data Figure 6
Extended Data Figure 6. Binding cavities for intravenous anaesthetics
a, Side view of a GABAAR-β3cryst surface representation. Dotted lines indicate the planes of the transverse sections shown in b and c. b, Transverse section through the pentamer at the level of 17′ His (His267), previously found to bind photolabelled propofol. c, Close-up of tilted transverse section indicated in (a), revealing the putative anaesthetic binding pockets in GABAAR-β3cryst in agreement with previous mutagenesis and photolabelling studies with etomidate and propofol analogues. P: propofol binding site. E: etomidate binding site.
Extended Data Figure 7
Extended Data Figure 7. Assembly interfaces between GABAAR-β3cryst subunits
a, Top and side (from the vestibule) view of two GABAAR-β3cryst neighbouring subunits, highlighting the nature of inter-subunit contacts between the “principal” (P) face of one subunit and “complementary” (C) face of the next (box indicates the region enlarged in e). Residues involved in salt-bridges are coloured purple and red, those forming putative hydrogen-bonds in cyan and residues forming van der Waals contacts are in orange. b, Analysis of the inter-subunit interfaces between the ECDs and the TMDs. Values shown correspond to the most extensive inter-subunit interface in each PDB entry. The ECD was defined from the N-terminus up to one residue C-terminal of the conserved Arg at the end of β10 strands in all pLGICs (Arg 216 in GABAAR-β3cryst). The TMD was defined as all residues beyond this point. c, “Open book” view of the inter-subunit interfaces (subunits were rotated 126° outwards around their long axis, relative to their side orientation in a), with surfaces coloured by the nature of interactions. Dotted lines delineate the trajectory of an inter-subunit side-tunnel. d, “Open book” view (as above) of the inter-subunit interfaces with surface shaded by degree of conservation among GABAAR and GlyR family members, revealing that key determinants of specificity are located largely in the ECDs where conservation is lower (Extended Data Fig. 7d). e, Top down view at the ECD-TMD interface level, showing key interactions within a single ECD (small oval) and between subunits (large oval). Grey dashed lines indicate putative hydrogen-bonds and salt-bridges. Boxed residues mark positions of disease mutations discussed in main text.
Extended Data Figure 8
Extended Data Figure 8. Comparison of the β9-β10 (loop C) conformation, the agonist-binding site and the ligand orientation in GABAAR-β3cryst and equivalent GluClα and AChBP regions
GABAAR-β3cryst is shown in grey (with blue strands) and its agonist benzamidine in green. Selected N and O atoms are in blue and red, respectively. a, Structural alignment of GABAAR-β3cryst and GluClα (PDB ID: 3RIF, red backbone, with its agonist glutamate in orange); b, Structural alignment of GABAAR-β3cryst and AChBP (PDB ID: 1UV6, red backbone) with agonist carbamylcholine bound (orange backbone); c, Structural alignment of GABAAR-β3cryst and AChBP (PDB ID: 2BYN, red backbone) in apo form; d, Structural alignment of GABAAR-β3cryst and AChBP (PDB ID: 2C9T, red backbone) in an inhibitor toxin bound form (the toxin was excluded for clarity). Key binding residues from loop B and loop C are presented to highlight interactions with nitrogen atoms. In both a and b, the β9-β10 strand of GABAAR-β3cryst adopts a similar conformation to the closed loop from GluClα-glutamate or AChBP-carbamylcholine. In both c and d, where AChBPs lack agonists, loop C is in an extended, open conformation different from its equivalent in GABAAR-β3cryst. Structural alignments were performed using SHP (see Methods).
Extended Data Figure 9
Extended Data Figure 9. Analysis of ECD-TMD interfaces and pore-lining M2 helices
a, Comparative analysis of ECD-TMD interfaces in pLGIC structures reported to date. Values correspond to chain A in each PDB entry. The ECD/TMD boundaries were set between the two residues C-terminal from the Arg that ends the β10 strands in all pLGICs (Arg 216 in GABAAR-β3cryst, see sequence alignment in Extended Data Fig. 3). b-f, GABAAR-β3cryst is shown in red (except the M2 helix, in teal). Its ECD was structurally aligned with equivalent regions of GluClα (PDB ID: 3RIF, in b), GLIC (PDB ID: 4HFI, in c), ELIC (PDB ID: 2VLO, in d), nAChR open (PDB ID: 4AQ9, in e) and nAChR closed (PDB ID: 4AQ5 in f). Alignments reveal relative variations in the ECD-TMD orientation. Structural alignments were performed using SHP (see Methods). g, Comparative analysis of M2 helix curvature, based on individual Cα positions, and pore diameter in GABAAR-β3cryst (desensitised conformation) versus GluCl (PDB ID: 3RIF, open conformation). Residues whose side chains line the pore are highlighted in bold. Pore diameters were calculated at the level of Cα atoms, using Caver (see Methods). Legend: Calculated as the difference between total accessible surface areas of isolated and interfacing structures, divided by two, using PISA. Indicates the solvation free energy gain upon formation of the interface. The value is calculated as difference in total solvation energies of isolated and interfacing structures, using PISA. *N residues: number of residues involved in ECD-TMD interactions. §NH/NSB/NvdW: number of putative H-bonds, salt bridges and additional van der Waals interactions that contribute to the ECD-TMD interface. Rotation of TMD relative to the equivalent region in GABAAR-β3cryst, around the inter-domain “effective hinge axis”, following superposition of the A-chain ECDs (calculated using DynDom, http://fizz.cmp.uea.ac.uk/dyndom/). ±The apparent register shift in the M2 and M3 helices (and connecting M2-M3 loop, which forms a large part of the ECD-TMD interface) in currently available nAChR models may impact on the values shown.
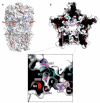
Figure 1
Figure 1. Architecture of GABAAR-β3cryst
a, GABAAR-β3cryst viewed parallel to the plasma membrane (α-helices red, except the pore-lining M2 shown in teal; β-strands blue; loops grey). N-linked glycans shown in orange “ball-and-stick” representation. b, View from the extracellular space (synaptic cleft) down the five-fold pseudo-symmetry axis, with a single subunit coloured in grey. c, Two subunits, rainbow coloured from blue N-terminus to red C-terminus, illustrating secondary structure nomenclature. A water-filled ECD vestibule and TMD pore shown in light green (diameter indicated periodically) runs through the five-fold pseudosymmetry axis of the pentamer, joined by lateral tunnels coming from between each of the subunit ECDs (two only shown for clarity, in grey). d, The pentameric transmembrane region, to illustrate the arrangement of helices M1-M4 and the M2-M3 loop (yellow). e, View of a lateral tunnel running between subunits into the central vestibule.
Figure 2
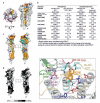
Figure 2. Assembly interactions in GABAAR-β3cryst
a, Top-down view of the GABAAR-β3cryst pentamer and side-on view from the vestibule of two neighbouring subunits, highlighting the nature of inter-subunit contacts between the “principal” face of one subunit and “complementary” face (residues marked by “c-”) of the next. Salt-bridging residues are coloured purple and red, those forming putative hydrogen-bonds in cyan, and residues forming van der Waals contacts in orange. b, The upper ECD close-up shows the inter-subunit α1-β1 loop (upper dotted oval), the inter-subunit salt-bridges connecting α1 helices (middle dotted oval) and inter-subunit α2-α2 interactions (lower dotted oval). Boxed residue labels correspond to disease mutations discussed in main text. c, The ECD anion-binding site and surrounding inter-subunit interface (chloride shown as a green sphere). Grey dashed lines indicate putative salt-bridges and hydrogen-bonds, green dashes indicate chloride coordination.
Figure 3
Figure 3. Neurotransmitter pocket occupied by the agonist benzamidine
a, Benzamidine (green/blue spheres) bound in the neurotransmitter pocket. Of note, the β8-β8′ loop, known as loop F (Arg169-Ala174; running into the red loop) in heteromeric GABAARs does not contribute to the GABAAR β3cryst orthosteric site. b, c, Benzamidine binding mode. “Complementary” face residues marked by “c-”. Grey dashed lines indicate putative hydrogen-bonds, salt-bridges and cation-π interactions; blue dashed lines indicate the coordination sphere of benzamidine nitrogen atoms. Boxed residue labels indicate disease mutations. d, Benzamidine dose-response curves determined by patch-clamp of GABAAR-β3cryst expressed in HEKS-GnTI cells (solid line) and by thermostabilisation of GABAAR-β3cryst in detergent micelles (dashed line; error bars are s.e.m.). e, Electrophysiological response to 10 mM benzamidine and block by 10 μM channel blocker fipronil (an alternative blocker, picrotoxin, also blocked GABAAR-β3cryst currents – Extended Data Figure 1d).
Figure 4
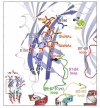
Figure 4. A conserved glycosylation site interacts with β9-β10 loop residues
Close-up of the N-linked glycosylation site 3, attached to the β7-strand that supports the β6-β7 (Cys) loop (Cys-bridge shown in black spheres) and its interactions with surrounding residues from the β9-β10 agonist binding loop (indicated by dashed orange lines; grey dashed lines highlight putative salt-bridges). Boxed residue labels correspond to disease mutations discussed in main text.
Figure 5
Figure 5. Structural coupling at the ECD-TMD interface
a, Side-on view of the ECD-TMD interface, rotated 135° in b. a, Putative hydrogen bonds (indicated by grey dashed lines) between residues of the β6-β7 (Cys) loop, the outer portion of the M2-M2 loop and the top of M3 and M4 helices. b, Hydrophobic packing in the ECDTMD interface on the pore side, involving residues from the β6-β7 loop, the β1-β2 loop, the inner portion of the M2-M3 loop and the N-terminus of the M1 helix from a neighbouring subunit. Boxed residue labels correspond to disease mutations discussed in main text.
Figure 6
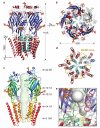
Figure 6. Structure of the ion channel in a desensitised state
a, Two GABAAR-β3cryst M2 helices (teal), with side chains of pore-lining residues in stick representation. An equivalent GluClα (3RIF) M2 helix, in orange, illustrates its distinct flexure. b, Pore diameter of GABAAR-β3cryst (teal) and related structures: open GluClα, open nAChR (4AQ9), closed nAChR (2BG9), open GLIC (4HFI) and closed ELIC (2VL0). c, Chain A superposition of pentameric GABAAR-β3cryst (red/teal) over GluClα (orange), revealing the relative rotation of transmembrane regions. d, The pore constriction at −2′ A248 in GABAAR-β3cryst compared to GluClα at −2′ P243, using alignment in c. e, Superposition of individual GABAA-β3cryst subunit TMDs over GluClα removes the relative rotation, but the pore remains shut, f. g, GABAAR-β3cryst (red/teal) showing Tyr299 “pressing” M2 to constrict the channel. In GluClα (orange) Phe294 points upwards, enabling an open pore conformation.

References

    1. Rabow LE, Russek SJ, Farb DH. From ion currents to genomic analysis: recent advances in GABAA receptor research. Synapse. 1995;21:189–274. - PubMed
    1. Grenningloh G, et al. Glycine vs GABA receptors. Nature. 1987;330:25–26. - PubMed
    1. Simon J, Wakimoto H, Fujita N, Lalande M, Barnard EA. Analysis of the set of GABA(A) receptor genes in the human genome. J. Biol. Chem. 2004;279:41422–41435. - PubMed
    1. Sigel E, Steinmann ME. Structure, function, and modulation of GABA(A) receptors. J. Biol. Chem. 2012;287:40224–40231. - PMC - PubMed
    1. Yip GM, et al. A propofol binding site on mammalian GABAA receptors identified by photolabeling. Nat. Chem. Biol. 2013;9:715–720. - PMC - PubMed

Publication types

MeSH terms

Associated data