

A single-cell imaging screen reveals multiple effects of secreted small molecules on bacteria
- PMID: 24910069
- PMCID: PMC4287172
- DOI: 10.1002/mbo3.176
A single-cell imaging screen reveals multiple effects of secreted small molecules on bacteria
Abstract
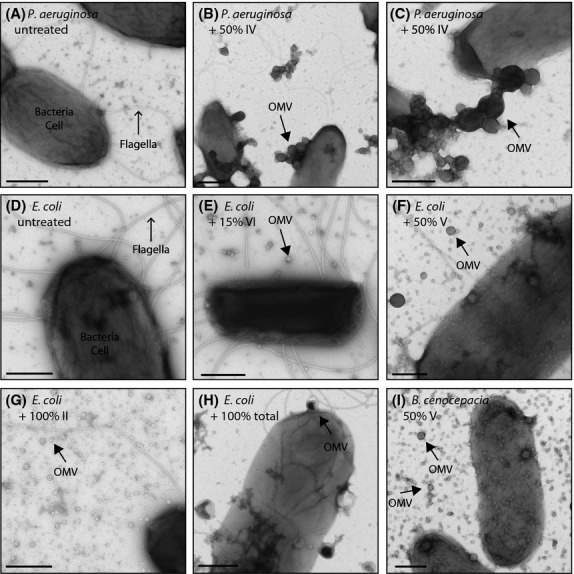
Bacteria cells exist in close proximity to other cells of both the same and different species. Bacteria secrete a large number of different chemical species, and the local concentrations of these compounds at the surfaces of nearby cells may reach very high levels. It is fascinating to imagine how individual cells might sense and respond to the complex mix of signals at their surface. However, it is difficult to measure exactly what the local environmental composition looks like, or what the effects of individual compounds on nearby cells are. Here, an electron microscopy imaging screen was designed that would detect morphological changes induced by secreted small molecules. This differs from conventional approaches by detecting structural changes in individual cells rather than gene expression or growth rate changes at the population level. For example, one of the changes detected here was an increase in outer membrane vesicle production, which does not necessarily correspond to a change in gene expression. This initial study focussed on Pseudomonas aeruginosa, Escherichia coli, and Burkholderia dolosa, and revealed an intriguing range of effects of secreted small molecules on cells both within and between species.
Keywords: Cell-cell communication; Pseudomonas aeruginosa; electron microscopy; secondary metabolites; small molecules.
© 2014 The Author. MicrobiologyOpen published by John Wiley & Sons Ltd.
Figures


Similar articles
-
Pseudomonas quinolone signal affects membrane vesicle production in not only gram-negative but also gram-positive bacteria.Microbes Environ. 2010;25(2):120-5. doi: 10.1264/jsme2.me09182. Microbes Environ. 2010. PMID: 21576862
-
Integrated approach to evaluating the toxicity of novel cysteine-capped silver nanoparticles to Escherichia coli and Pseudomonas aeruginosa.Analyst. 2014 Mar 7;139(5):954-63. doi: 10.1039/c3an01648j. Epub 2013 Dec 17. Analyst. 2014. PMID: 24343373
-
The Mla Pathway Plays an Essential Role in the Intrinsic Resistance of Burkholderia cepacia Complex Species to Antimicrobials and Host Innate Components.J Bacteriol. 2018 Aug 24;200(18):e00156-18. doi: 10.1128/JB.00156-18. Print 2018 Sep 15. J Bacteriol. 2018. PMID: 29986943 Free PMC article.
-
The Mechanism of Killing by the Proline-Rich Peptide Bac7(1-35) against Clinical Strains of Pseudomonas aeruginosa Differs from That against Other Gram-Negative Bacteria.Antimicrob Agents Chemother. 2017 Mar 24;61(4):e01660-16. doi: 10.1128/AAC.01660-16. Print 2017 Apr. Antimicrob Agents Chemother. 2017. PMID: 28137800 Free PMC article.
-
Permeation of beta-lactam antibiotics into Escherichia coli, Pseudomonas aeruginosa, and other gram-negative bacteria.Rev Infect Dis. 1988 Jul-Aug;10(4):691-8. doi: 10.1093/clinids/10.4.691. Rev Infect Dis. 1988. PMID: 3142011 Review.
Cited by
-
Effect of extracytoplasmic function sigma factors on autoaggregation, hemagglutination, and cell surface properties of Porphyromonas gingivalis.PLoS One. 2017 Sep 20;12(9):e0185027. doi: 10.1371/journal.pone.0185027. eCollection 2017. PLoS One. 2017. PMID: 28931045 Free PMC article.
-
Reciprocal cross-species induction of outer membrane vesicle biogenesis via secreted factors.Sci Rep. 2018 Jun 29;8(1):9873. doi: 10.1038/s41598-018-28042-4. Sci Rep. 2018. PMID: 29959355 Free PMC article.
-
Membrane Distribution of the Pseudomonas Quinolone Signal Modulates Outer Membrane Vesicle Production in Pseudomonas aeruginosa.mBio. 2017 Aug 8;8(4):e01034-17. doi: 10.1128/mBio.01034-17. mBio. 2017. PMID: 28790210 Free PMC article.
References
-
- Diggle SP. Microbial communication and virulence: lessons from evolutionary theory. Microbiology. 2010;156:3503–3512. - PubMed
Publication types
MeSH terms
LinkOut - more resources
Full Text Sources
Other Literature Sources
Molecular Biology Databases
