. 2014 Jul 17;55(2):199-213.
doi: 10.1016/j.molcel.2014.05.006. Epub 2014 Jun 5.

Identification of bacteriophage-encoded anti-sRNAs in pathogenic Escherichia coli

Affiliations

Identification of bacteriophage-encoded anti-sRNAs in pathogenic Escherichia coli

Jai J Tree et al. Mol Cell. .

Abstract

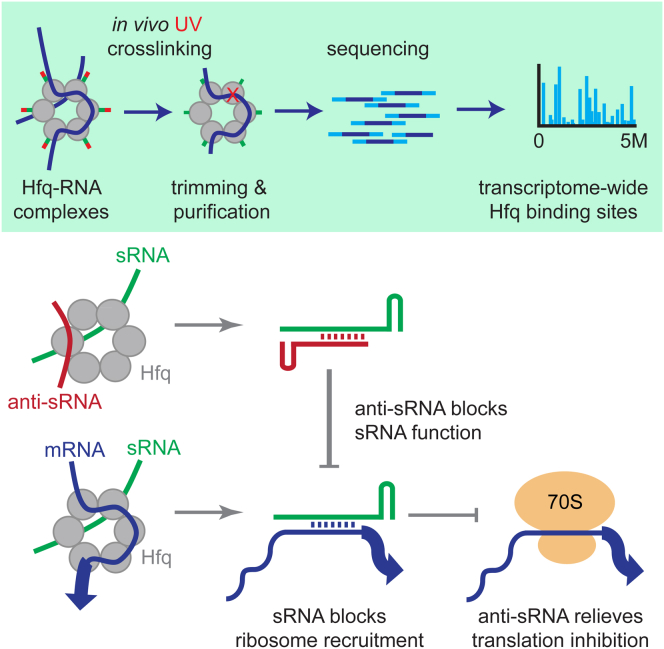
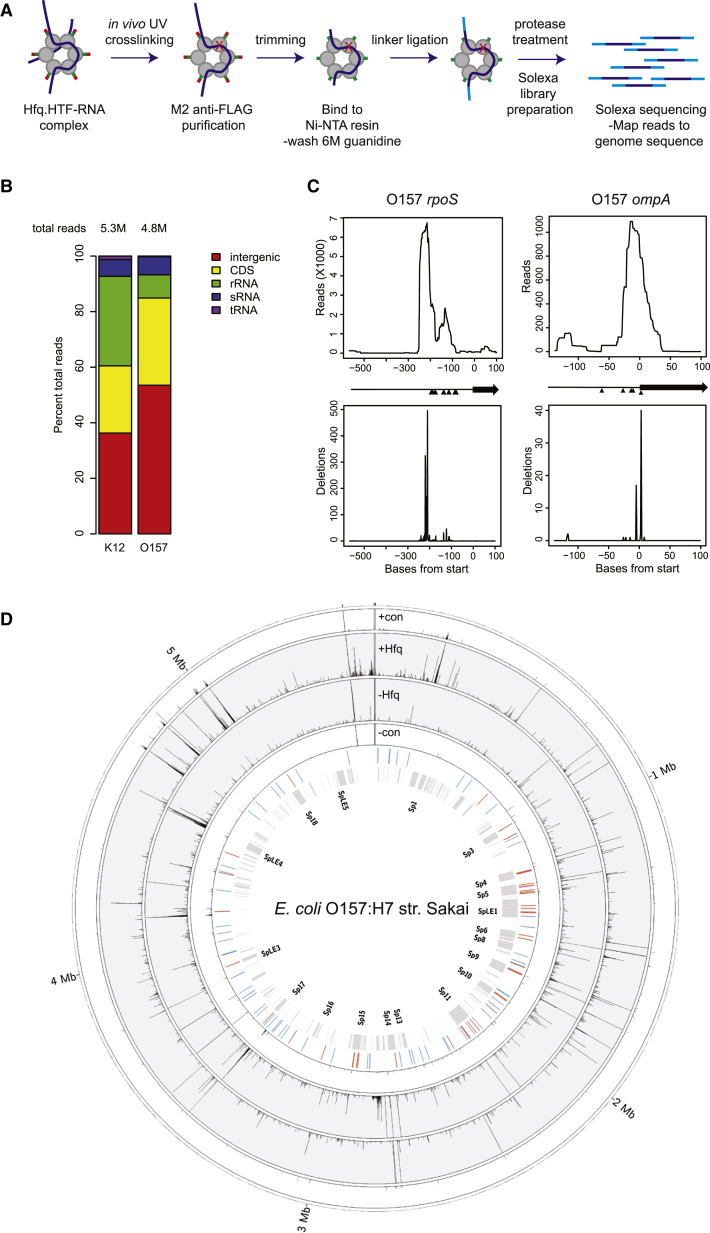
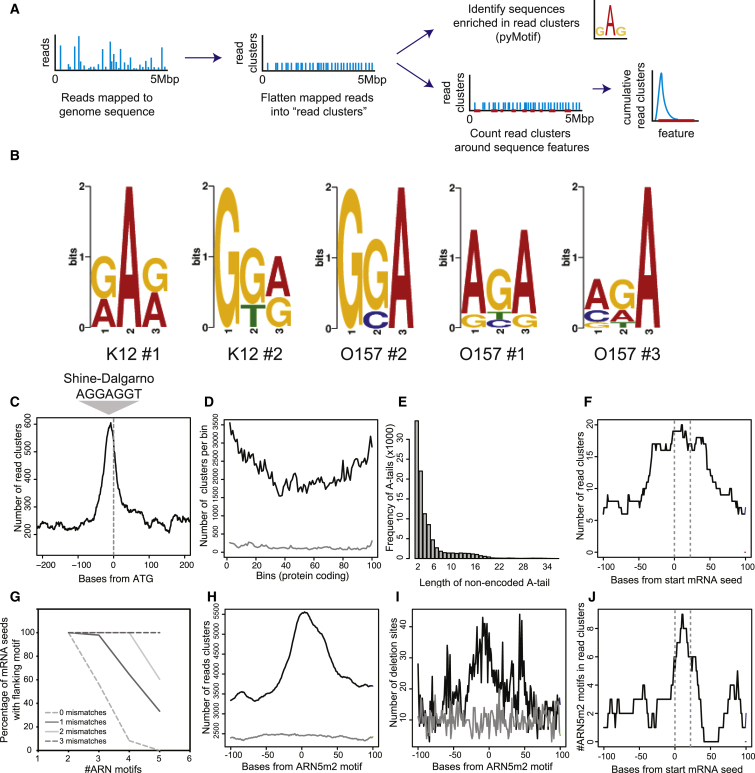
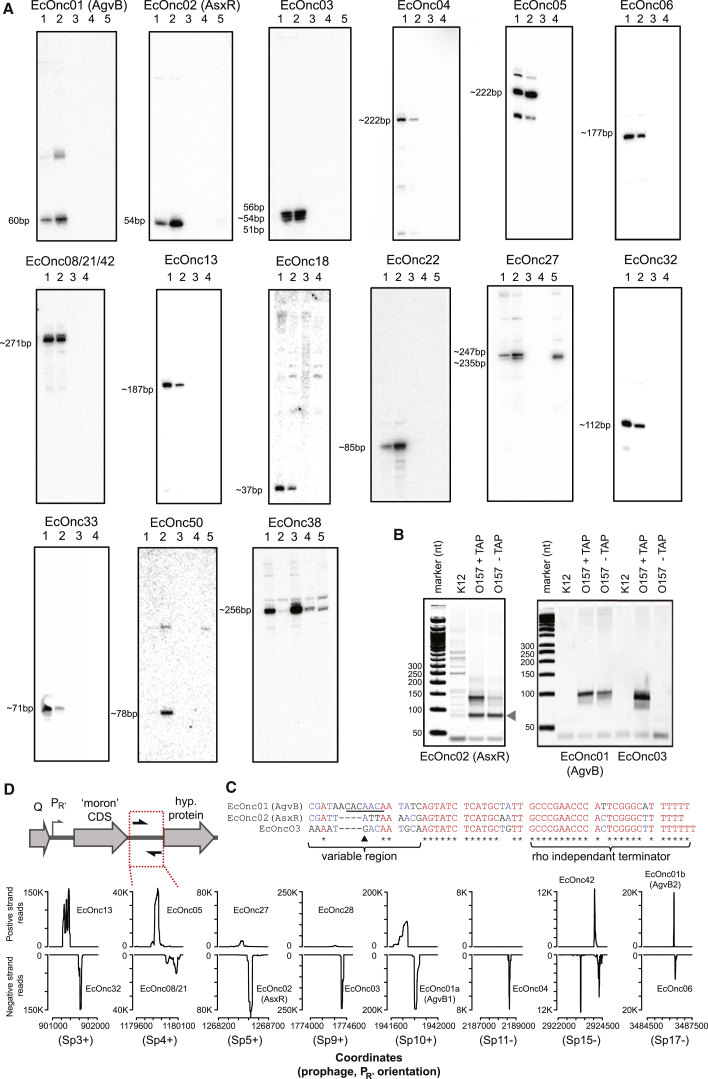
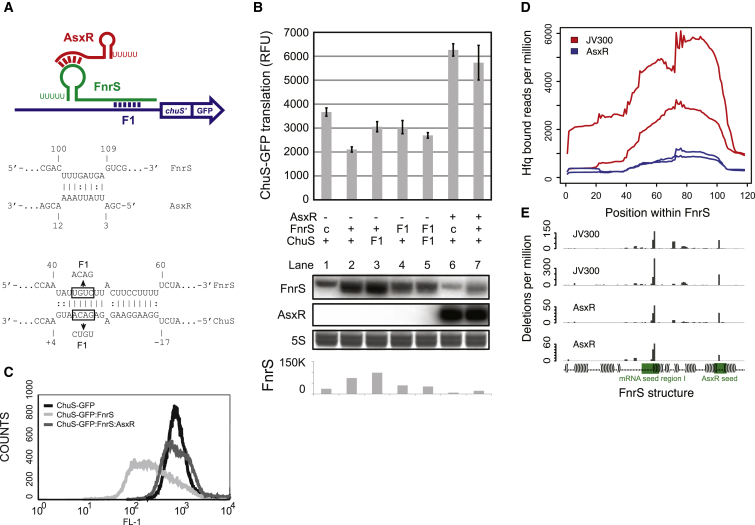
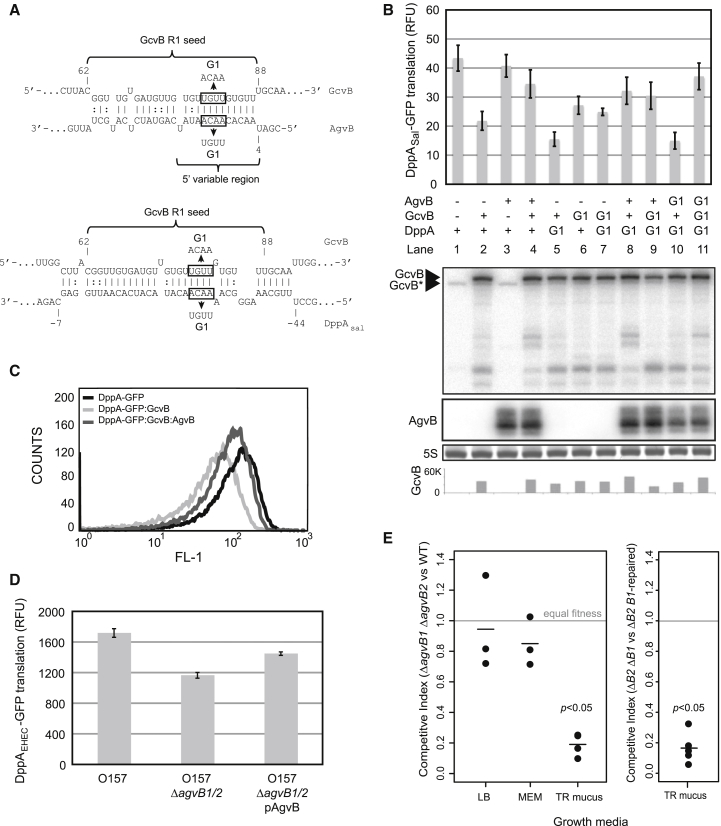
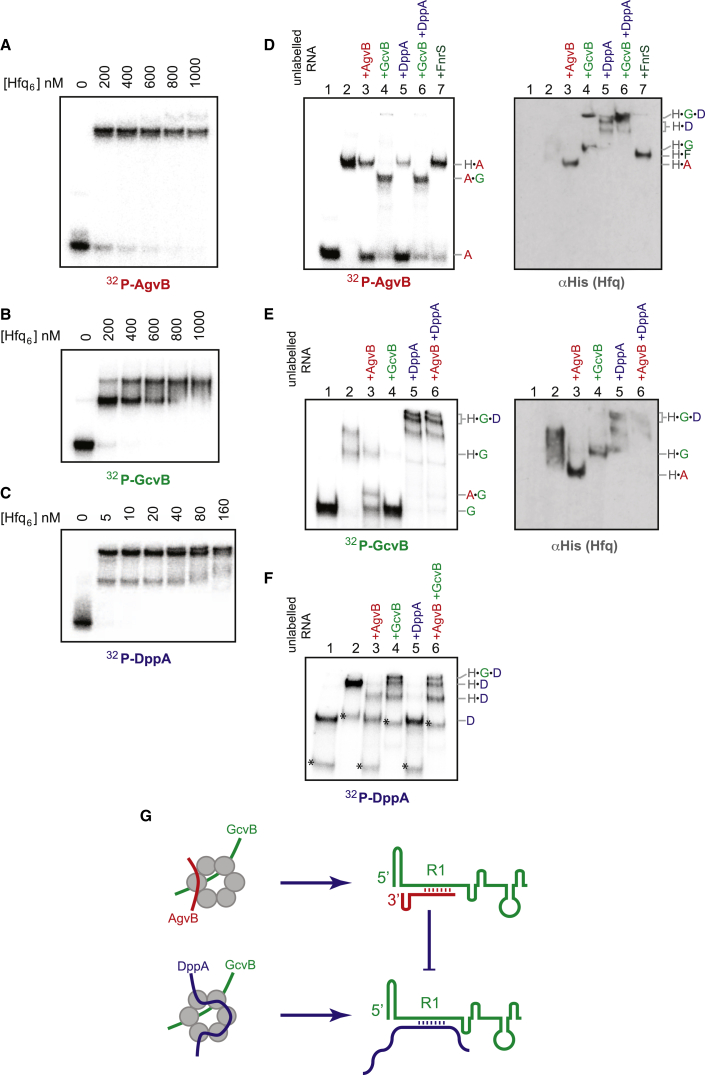
In bacteria, Hfq is a core RNA chaperone that catalyzes the interaction of mRNAs with regulatory small RNAs (sRNAs). To determine in vivo RNA sequence requirements for Hfq interactions, and to study riboregulation in a bacterial pathogen, Hfq was UV crosslinked to RNAs in enterohemorrhagic Escherichia coli (EHEC). Hfq bound repeated trinucleotide motifs of A-R-N (A-A/G-any nucleotide) often associated with the Shine-Dalgarno translation initiation sequence in mRNAs. These motifs overlapped or were adjacent to the mRNA sequences bound by sRNAs. In consequence, sRNA-mRNA duplex formation will displace Hfq, promoting recycling. Fifty-five sRNAs were identified within bacteriophage-derived regions of the EHEC genome, including some of the most abundant Hfq-interacting sRNAs. One of these (AgvB) antagonized the function of the core genome regulatory sRNA, GcvB, by mimicking its mRNA substrate sequence. This bacteriophage-encoded "anti-sRNA" provided EHEC with a growth advantage specifically in bovine rectal mucus recovered from its primary colonization site in cattle.


Figures

None
Graphical abstract
Figure 1
Figure 1
UV Crosslinking of Hfq-RNA Correlates with In Vitro Footprinting of Hfq to Abundant mRNAs (A) Workflow for CRAC analysis of Hfq. A detailed protocol is presented in Supplemental Experimental Procedures and Figure S1. (B) Distribution of Hfq-bound reads between transcript classes in E. coli K12 str. MG1655 and E. coli O157 str. Sakai. Total reads are indicated above bars. (C) Sequencing reads recovered from Hfq CRAC that map to rpoS or ompA mRNAs (top) and deletions recovered within sequencing reads (below). Black arrows between plots indicate the position of coding sequence (arrow) and 5′ UTR (line). Black triangles indicate position of nucleotides protected by Hfq in footprinting experiments in vitro (Moll et al., 2003; Soper and Woodson, 2008). (D) Transcriptome-wide profiling of Hfq binding sites. Numbers of Hfq-associated reads mapped to the positive strand (+Hfq) and negative strand (−Hfq) are plotted in the gray line plots (y axis maximum 20,000 reads). Control experiments with untagged protein are plotted in the white outer and inner line plots (con±; y axis maximum 10,000 reads). From the inner-most track: text indicates designations for pathogenicity islands, with the position of all pathogenicity islands indicated by the gray boxes in the next track. The positions of sRNAs identified in this study are indicated in red, with previously described sRNAs in blue.
Figure 2
Figure 2
Hfq Binds an ARN Motif Adjacent or Overlapping the mRNA Seed Sequence (A) Workflow for analysis of Hfq crosslinked reads. Mapped reads were flattened into read clusters to prevent bias toward highly enriched sites. Read clusters are analyzed for enriched motifs (as in [B]) or their culmulative distrubution around sequence features such as CDS and mRNA seed regions (as in [C]–[J]). (B) pyMotif from the pyCRAC software package was used to identify trimers that were enriched within RNAs crosslinked to Hfq in five independent experiments. Hfq was crosslinked in either nonpathogenic E. coli K12 str. MG1655 (K12) or enterohemorhaggic E. coli O157:H7 str. Sakai (O157). All five logos fit either a repeated AGG or AGA sequence (indicated below). (C) Cumulative Hfq-bound read clusters are plotted relative to the start codon (indicated by gray dashed line). The sequence and approximate position of the Shine-Dalgarno sequence is indicated above. (D) Cumulative Hfq binding within coding sequences. CDS were divided into 100 bins and scored for overlapping read clusters. The cumulative score (genome wide) for each bin is indicated in black and the cumulative score for shuffled CDS coordinates in gray (CDS were assigned random positions within the genome). (E) Frequency of non-genomically encoded oligo(A)-tail length recovered from Hfq-bound reads. (F) Cumulative Hfq-bound read clusters within 100 nt of experimentally verified mRNA seed sequences. Grey dashed lines indicate the position and width for the average mRNA seed. (G) Percent of mRNA seeds with ARN motifs within 100 nt allowing mismatched postions. The x axis represents the number of ARN repeats within a motif, and the y axis represents the percentage of mRNA seeds with that motif within 100 nt. The percentage of mRNA seeds with a flanking ARN motif is plotted for zero to three mismatched postions. (H) Transcriptome-wide cumulative count of Hfq bound read clusters at ARN5m2 motifs (black) and control shuffled ARN5m2 coordinates (gray). (I) Transcriptome-wide cumulative count of deletions in Hfq-bound read clusters at ARN5m2 motifs (indicating direct Hfq contact; black) and control shuffled ARN5m2 coordinates (gray). (J) Position of ARN5m2 motifs within Hfq bound reads at experimentally verified mRNA seed sequences (see also Figure S2 for sequences). Grey dashed lines indicate the position and average width of mRNA seed sequences.
Figure 3
Figure 3
Hfq Binds Single-Stranded, U-Rich Sequences in sRNAs (A) Hfq binding relative to sRNA seed sequences. Small RNAs (indicated right) are aligned to the start of their respective seed regions (dashed line). Each heatmap indicates Hfq binding along the sRNA. (B) A 2U sequence is enriched 5′ of the site of maximal deletions (indicating direct Hfq contact). Positions relative to the site of maximal deletions within 20 Hfq-dependant sRNAs were scored for frequency of a uridine nucleotide. The probability of randomly enriching U at a given position (FDR) is given by the gray dashed line (q ≈ 0.05). (C) Hfq is crosslinked to single-stranded nucleotides within sRNAs. The secondary structure of 20 Hfq-dependent sRNAs was predicted using the UNAfold software package and nucleotides surrounding the site of maximal deletions were scored as base paired (+1) or unpaired (−1). The cumulative score for nucleotides from 20 Hfq-dependent sRNAs are plotted against their position relative to the maximal crosslinking site for three independent experiments. False discovery rate is given by the gray dashed line (q ≈ 0.05).
Figure 4
Figure 4
Identification of Prophage-Encoded sRNAs in E. coli O157 (A) Northern blot analysis of predicted sRNAs (also see Table S2) in E. coli O157:H7 str. Sakai (O157) and nonpathogenic E. coli K12 (K12) cultured under virulence inducing conditions (MEM-HEPES) and in LB broth. Lane 1: O157 grown in MEM-HEPES; lane 2: O157 grown in LB; lane 3: K12 grown in MEM-HEPES; lane 4: K12 grown in LB; lane 5 (where applicable): O157Δhfq grown in LB. Approximate size of RNAs indicated left of blot. (B) 5′ RLM-RACE with and without tobacco acid pyrophophatase (TAP) treatment of EcOnc01–EcOnc03. Grey arrow indicates a primer dimer. (C) Prophage encode convergent sRNAs within the “moron” insertion site at PR’. (Top) Graphical representation of gene organization at the moron CDS insertion site showing the phage regulator, antiterminator Q CDS, and promoter PR’. Moron CDSs are inserted downstream of PR’, and convergent sRNAs are encoded between the moron CDS and a conserved hypothetical phage ORF. (Bottom) Hfq-bound reads are plotted for the intergenic region between moron CDS and downstream hypothetical ORF (indicated by red box above) for prophages encoding convergent sRNAs. Prophage designation and strand encoding PR’ are given in brackets. Peaks that have been assigned to predicted sRNA are indicated. (D) Alignment of EcOnc01–3. Underlined sequence in EcOnc01 corresponds to the GcvB targeting consensus. The black triangle indicates the shortest alternate 5′ triphosphate end detected by 5′RLM-RACE in EcOnc03.
Figure 5
Figure 5
The Shiga Toxin 2 Locus Encodes an Anti-sRNA that Enhances Expression of the Heme Oxygenase ChuS (A) (Top) Graphical representation of interactions between AsxR, FnrS, and the chuS mRNA. F1 indicates the positions of the complementary mutation. (Bottom) Predicted base paring (IntalRNA software) between AsxR and FnrS, and FnrS and the chuS transcript. Boxes and arrows indicate sequence changes that were introduced into F1 mutants. (B) (Upper panel) Fluorescence of the 3′ chuA→5′ chuS chuS-GFP translational fusion was monitored in the presence of FnrS, AsxR, and appropriate point mutants (indicated below bar chart; basal levels of chromosomal FnrS are indicated by “c”). (Lower panel) Northern blot analysis of FnrS and AsxR (indicated). SYBR-green-stained 5S rRNA (5S) is included as a loading control. (Bottom) Quantification of FnrS northern blots by densitometry. Error bars indicate SEM. (C) Flow cytometry quantification of fluorescence from cells expressing chuS-GFP alone, with FnrS, or with both FnrS and AsxR. (D) AsxR reduces Hfq-bound FnrS. The chuS-GFP fusion and FnrS were constitutively expressed in E. coli MG1655 hfq-HTF with AsxR (blue) or the control plasmid pJV300 (red) and CRAC performed on these strains. Replicate data sets are plotted as reads per million across FnrS. (E) Hfq binds to both seed and 3′ loop regions of FnrS. Deletions per million Hfq-bound reads are plotted relative to secondary structure of FnrS. Major deletion sites are located within the mRNA seed region I (green) and the AsxR seed region (green) within the terminator loop. See also Figure S3.
Figure 6
Figure 6
EcOnc01 (AgvB) Acts as an “Anti-sRNA” to Inhibit GcvB Repression (A) Interactions between GcvB and AgvB (top) and GcvB and DppASal (bottom) were predicted using IntaRNA software. The R1 seed sequence of GcvB is indicated in braces, and sequences that were introduced into G1 mutants are indicated within boxes. (B) Fluorescence of DppAsal-GFP was used to monitor GcvB activity in the presence of AgvB, GcvB, and G1 mutants. Genotypes for each reading are indicated below. (Below: GcvB and AgvB) Northern analysis of GcvB and AgvB, respectively. GcvB indicates the endogenous copy of GcvB, which carries an 8 nt deletion in the R1 seed region. SYBR-green-stained 5S rRNA (5S) is shown as a loading control for GcvB and AgvB northern blots. The bottom panel shows quantification of the exogenous copy of GcvB by densitometry. Error bars indicate SEM. (C) Flow cytometry quantification of fluorescence from individual cells expressing DppAsal-GFP alone, with GcvB, or with both GcvB and AgvB. (D) Fluorescence of DppAEHEC-GFP was used to monitor translation efficiency of DppA in E. coli O157:H7, ΔagvB1 ΔagvB2, and the complemented strain ΔagvB1 ΔagvB2 pZE12::EcOnc01 (pAgvB). (E) The left-hand panel shows the competitive indices of E. coli O157 ΔagvB1 ΔagvB2 against the parent stain (Sakai) grown in LB media (n = 3), MEM-HEPES media (MEM, n = 3), and terminal rectal mucus (TR mucus, n = 4). The right-hand panel shows the competitive indices for the double mutant E. coli O157 ΔagvB1 ΔagvB2 against the same strain complemented on the chromosome with agvB1 (TR mucus, n = 5). A competitve index of 1 indicates no fitness difference; <1 indicates a fitness disadvantage.
Figure 7
Figure 7
EMSA Analysis in Hfq-AgvB Interactions (A–C) Approximately 40 fmol of in-vitro-transcribed, radiolabeled AgvB (A), GcvB (B), or the 5′ 166 nt of DppASal (C) were incubated with increasing amounts of Hfq6 (indicated above). (D–F) (Left panels) Competition assays with unlabelled RNAs. Radiolabelled AgvB (D), GcvB (E), or DppA (F), were incubated in the absence (lane 1) or presence of 500 nM Hfq6 (AgvB and GcvB) or 50 nM Hfq6 (DppA) (lanes 2–7). Hfq binding reactions were additionally incubated in the presence of a 50-fold excess of unlabelled competitor RNAs (indicated above gel, lanes 3–7). The composition of complexes is indicated on the right-hand side (H = Hfq, A = AgvB, G = GcvB, and D = DppA). For radiolabeled DppA (F), a shorter DppA RNA fragment copurified with the full-length product and is indicated by an asterisk. (D and E) (Right panels) αHis western blot analysis of EMSA gels to monitor the presence of His6-tagged Hfq in gel-shifted complexes. Lanes are as in the left panels. In lanes E2 and E3, Hfq migrates as a smear, probably because it copurifies with heterogenous RNA species (Sittka et al., 2008), which are displaced in the presence of higher added concentrations of RNAs. In Figure 7F, the low Hfq concentration (50 nM) was not detectable by western analysis in DppA EMSA gels. (G) Model for interaction of AgvB with Hfq, GcvB, and DppA. AgvB binds the distal face of Hfq (see also Figure S4) and forms a duplex with the R1 region of GcvB. Occlusion of the R1 region of GcvB prevents interactions between GcvB and the mRNA DppA. AgvB may also displace DppA from Hfq, although this interaction would be expected to be much more transient than inhibition through occlusion of GcvB R1. In the absence of AgvB, Hfq facilitates duplex formation between DppA and GcvB, repressing translation of DppA.

References

    1. Bandyra K.J., Luisi B.F. Licensing and due process in the turnover of bacterial RNA. RNA Biol. 2013;10:627–635. - PMC - PubMed
    1. Beisel C.L., Updegrove T.B., Janson B.J., Storz G. Multiple factors dictate target selection by Hfq-binding small RNAs. EMBO J. 2012;31:1961–1974. - PMC - PubMed
    1. Blum E., Carpousis A.J., Higgins C.F. Polyadenylation promotes degradation of 3′-structured RNA by the Escherichia coli mRNA degradosome in vitro. J. Biol. Chem. 1999;274:4009–4016. - PubMed
    1. Bossi L., Schwartz A., Guillemardet B., Boudvillain M., Figueroa-Bossi N. A role for Rho-dependent polarity in gene regulation by a noncoding small RNA. Genes Dev. 2012;26:1864–1873. - PMC - PubMed
    1. Bouvier M., Sharma C.M., Mika F., Nierhaus K.H., Vogel J. Small RNA binding to 5′ mRNA coding region inhibits translational initiation. Mol. Cell. 2008;32:827–837. - PubMed

Publication types

MeSH terms

Associated data