. 2014 Jun:408:123-31.
doi: 10.1016/j.jim.2014.05.014. Epub 2014 Jun 5.

The impact of Nucleofection® on the activation state of primary human CD4 T cells

Affiliations

The impact of Nucleofection® on the activation state of primary human CD4 T cells

Mingce Zhang et al. J Immunol Methods. 2014 Jun.

Abstract

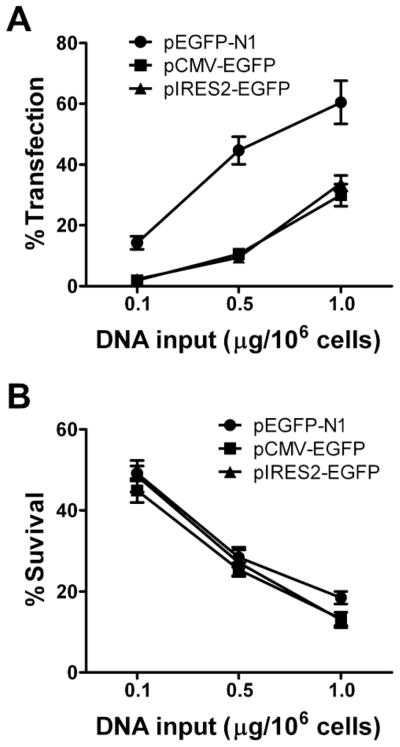
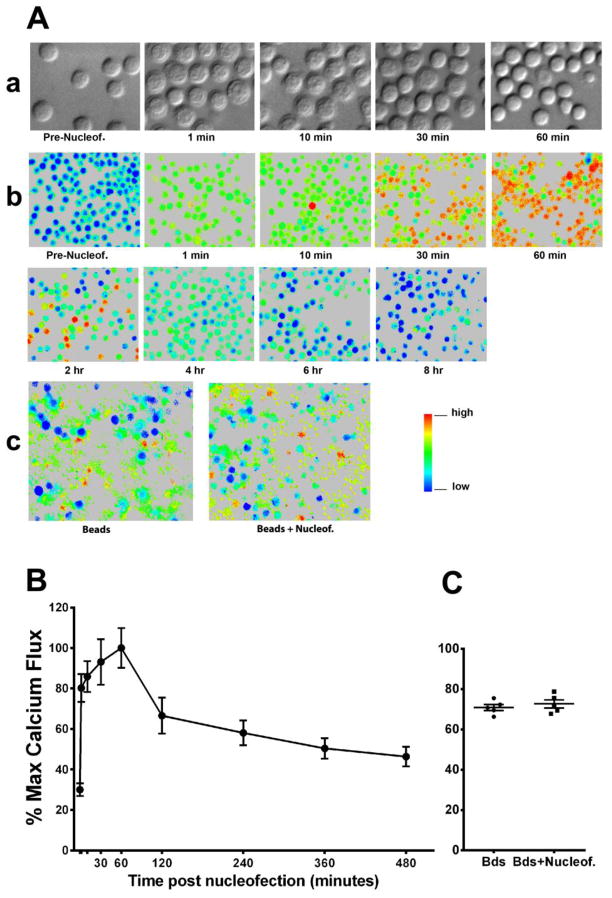
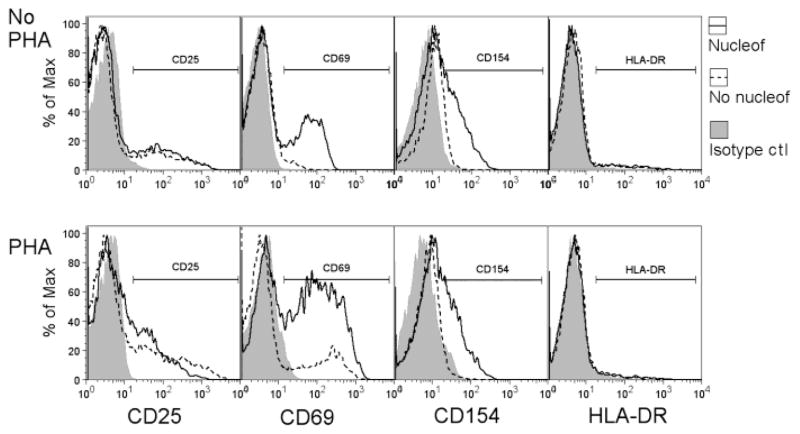
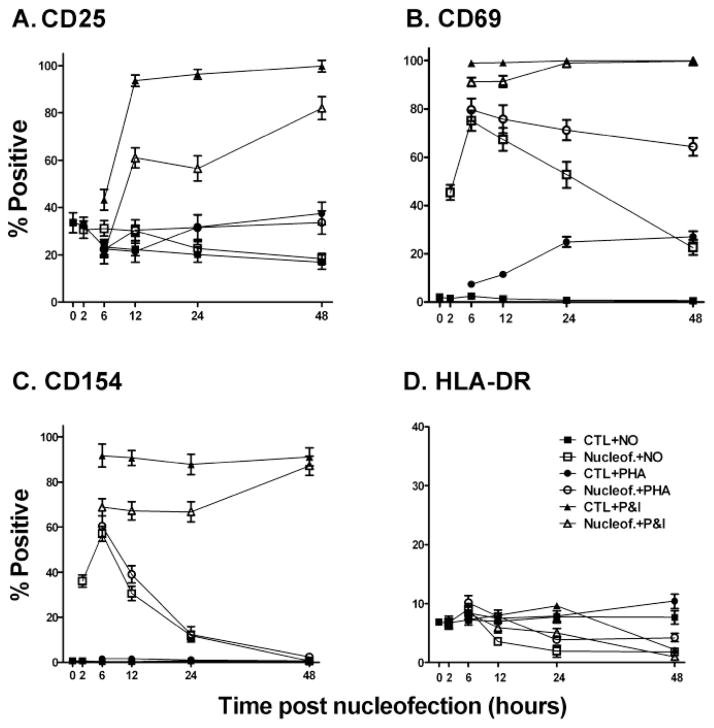
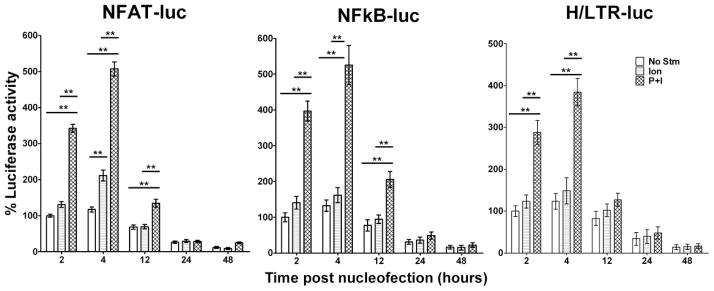
Gene transfer into primary human CD4 T lymphocytes is a critical tool in studying the mechanism of T cell-dependent immune responses and human immunodeficiency virus-1 (HIV-1) infection. Nucleofection® is an electroporation technique that allows efficient gene transfer into primary human CD4 T cells that are notoriously resistant to traditional electroporation. Despite its popularity in immunological research, careful characterization of its impact on the physiology of CD4 T cells has not been documented. Herein, using freshly-isolated primary human CD4 T cells, we examine the effects of Nucleofection® on CD4 T cell morphology, intracellular calcium levels, cell surface activation markers, and transcriptional activity. We find that immediately after Nucleofection®, CD4 T cells undergo dramatic morphological changes characterized by wrinkled and dilated plasma membranes before recovering 1h later. The intracellular calcium level also increases after Nucleofection®, peaking after 1h before recovering 8h post transfection. Moreover, Nucleofection® leads to increased expression of T cell activation markers, CD154 and CD69, for more than 24h, and enhances the activation effects of phytohemagglutinin (PHA) stimulation. In addition, transcriptional activity is increased in the first 24h after Nucleofection®, even in the absence of exogenous stimuli. Therefore, Nucleofection® significantly alters the activation state of primary human CD4 T cells. The effect of transferred gene products on CD4 T cell function by Nucleofection® should be assessed after sufficient resting time post transfection or analyzed in light of the activation caveats mentioned above.

Keywords: Calcium; Gene transfer; HIV-1; Nucleofection®; Plasmid; T cell activation.


Figures

Fig. 1
Fig. 1
Highly efficient gene transfer into primary human CD4 T cells by Nucleofection®. Freshly isolated human CD4 T cells underwent Nucleofection® with GFP expression vectors, pEGFP-N1, pCMS-EGFP, or pIRES2-EGFP, at 3 different doses. GFP expression (A) and cell viability (B) were assayed 24 hours post transfection and are represented as percent positive live cells and percent survival, respectively. Results are shown as means ± SD for three similar experiments. Two-way ANOVA analysis was performed: GFP expression in pEGFP-N1 transfected cells was significantly higher than in either pCMV-EGFP or pIRES2-EGFP transfected cells, p<0.01; there was no statistically significant difference in cell viability among the groups of transfected cells, p>0.05). Linear regression analysis revealed GFP expression is directly related to transfected DNA dosage for all plasmids studied (p<0.01): pEGFP-N1 (R2=0.8286), pCMV-EGFP (R2=0.9091), and pIRES2-EGFP (R2=0.9085).
Fig. 2
Fig. 2
The impact of Nucleofection® on CD4 T cell morphology and intracellular Ca2+ levels. 5x10⁶ CD4 T cells were immediately transferred to cell culture medium after Nucleofection® with 2.5 μg of the empty control vector, Rc/CMV. (A) Representative imaging shows (a) morphological changes over time after transfection as evaluated by Nomarski DIC microscopy, (b) changes of intracellular Ca2+ levels after transfection over time (the level of Ca2+ is indicated by the 340/380 ratio shown in pseudocolor), and (c) calcium flux of non-transfected CD4 T cells and CD4 T cells 8 hours post Nucleofection® in response to beads conjugated with anti-CD3 and anti-CD28 antibodies. Results are representative of three similar experiments. (B) The degree of calcium flux before and after Nucleofection® was analyzed by quantifying the 340/380 ratios reflected by color changes; calcium flux percentage was further calculated by normalizing all values of other time points to the value of the one hour time point sample (maximal value). The graph shows a summary of 3 experiments from different donors plotted as means ± SD. (C) A summary of calcium flux percentages obtained in non-transfected CD4 T cells and CD4 T cells eight hours post Nucleofection® in response to anti-CD3/CD28 beads from 5 separate donors. The data is plotted as means ± SD.
Fig. 3
Fig. 3
The impact of Nucleofection® on the expression of CD4 T cell surface activation markers. 5x10⁶ primary human CD4 T cells were transfected with 2.5 μg of the empty control vector, Rc/CMV, and rested for 2 hours. Transfected cells (Amaxa, solid line) were then cultured with or without 2.5 μg/ml of PHA for 24 hours before being stained for CD25, CD69, CD154, and HLA-DR expression. As controls, non-transfected CD4 T cells (dashed line) were cultured for 24 hours with or without PHA before being stained for surface markers. Results are representative of three similar experiments.
Fig. 4
Fig. 4
The impact of Nucleofection® on the expression of CD4 T cell surface activation markers over time. 5x10⁶ primary human CD4 T cells were transfected with 2.5 μg of the empty control vector, Rc/CMV, and rested for 2 hours. Transfected cells were then stimulated with 2.5 μg/ml PHA, 10 ng/ml PMA plus 0.5 μM ionomycin, or nothing. Cells were then cultured until the subsequent time points when they were collected and stained for CD25 (A), CD69 (B), CD154 (C), and HLA-DR (D) expression. Non-transfected CD4 T cells were treated the same as controls. Expression of surface markers at 2 hours was monitored for unstimulated CD4 T cells. Values at the 0 hour time point indicate expression levels of non-transfected and unstimulated CD4 T cells. Results are shown as means ± SD for three similar experiments. Two-way ANOVA analysis was performed. For CD25 expression, for either no stimulation of PHA stimulation, there were no differences between control cells and cells undergoing nucleofection (p>0.05). For CD69 expression, transfected cells that were untreated or PHA stimulated had significantly higher expression than controls (p<0.01); PMA and ionomycin (P&I) treated cells undergoing nucleofection had significantly less expression than controls at the 6 and 12 hour time points (p<0.01) but were not different at the later time points. Similar results were noted for CD154 with the exception that only the 48 hour time point was not lower for the transfected cells (p>0.05). There were no significant differences in HLA-DR expression at any time point for the transfected versus the control cells for all 3 conditions.
Fig. 5
Fig. 5
CD4 T cell responses to stimulation as measured by transcriptional activities of luciferase reporter genes introduced by Nucleofection®. 5x10⁶ primary human CD4 T cells underwent Nucleofection® with 2.5 μg of DNA constructs containing luciferase reporter genes driven by NFAT (left), NFκB (middle), or the HIV-1 LTR/promoter (right). pRenilla-null was also transfected as an internal transfection efficiency control. Cells were rested for 2 hours or 4 hours, or cultured in the presence of rhIL-2 (20 units/ml) for 12 hours, 24 hours, or 48 hours prior to stimulation with, ionomycin alone (Ion), or PMA and ionomycin (P+I) for 6 hours. Luciferase activities were assayed after stimulation and percent luciferase levels were calculated as detailed in the Materials and Methods. Results are a summary of three similar experiments with means ± SD plotted. Two-way ANOVA analysis revealed significant differences between the paired groups (**, p<0.01).

Similar articles

Cited by

References

    1. Behre G, Smith LT, Tenen DG. Use of a promoterless Renilla luciferase vector as an internal control plasmid for transient co-transfection assays of Ras-mediated transcription activation. Biotechniques. 1999;26:24–6. 28. - PubMed
    1. Chiu YL, Soros VB, Kreisberg JF, Stopak K, Yonemoto W, Greene WC. Cellular APOBEC3G restricts HIV-1 infection in resting CD4+ T cells. Nature. 2005;435:108–14. - PubMed
    1. Chrivia JC, Wedrychowicz T, Young HA, Hardy KJ. A model of human cytokine regulation based on transfection of gamma interferon gene fragments directly into isolated peripheral blood T lymphocytes. J Exp Med. 1990;172:661–4. - PMC - PubMed
    1. Crabtree GR, Olson EN. NFAT signaling: choreographing the social lives of cells. Cell. 2002;109(Suppl):S67–79. - PubMed
    1. Cron RQ. CD154 transcriptional regulation in primary human CD4 T cells. Immunol Res. 2003;27:185–202. - PubMed

Publication types

MeSH terms