. 2014 Jun 26;7(6):1789-95.
doi: 10.1016/j.celrep.2014.05.018. Epub 2014 Jun 5.

Negative feedback in genetic circuits confers evolutionary resilience and capacitance

Affiliations

Negative feedback in genetic circuits confers evolutionary resilience and capacitance

David C Marciano et al. Cell Rep. .

Abstract

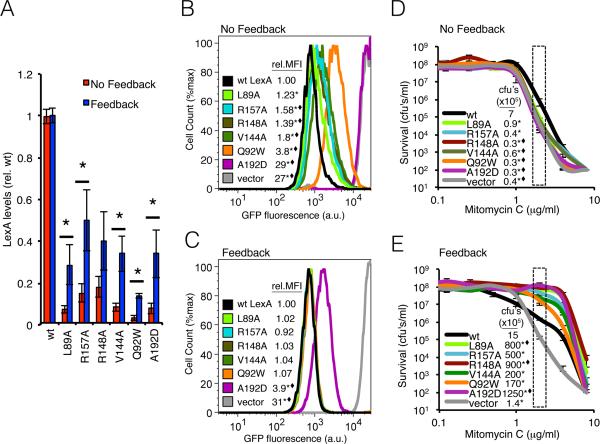
Natural selection for specific functions places limits upon the amino acid substitutions a protein can accept. Mechanisms that expand the range of tolerable amino acid substitutions include chaperones that can rescue destabilized proteins and additional stability-enhancing substitutions. Here, we present an alternative mechanism that is simple and uses a frequently encountered network motif. Computational and experimental evidence shows that the self-correcting, negative-feedback gene regulation motif increases repressor expression in response to deleterious mutations and thereby precisely restores repression of a target gene. Furthermore, this ability to rescue repressor function is observable across the Eubacteria kingdom through the greater accumulation of amino acid substitutions in negative-feedback transcription factors compared to genes they control. We propose that negative feedback represents a self-contained genetic canalization mechanism that preserves phenotype while permitting access to a wider range of functional genotypes.


Figures

Fig. 1
Fig. 1
Negative feedback diminishes the deleterious effects of mutations. Ptrc (No Feedback) or the native PlexA (Feedback) drive expression of LexA and mutants thereof. (A) Semi-quantitative Western blot data of steady-state LexA expression levels. Mean values are relative to isogenic plasmid encoding wild type LexA. Significance based on t-test: * p < 0.05. Error bars represent SEM of ≥4 biological replicates. (B) Flow cytometry data showing the distribution of each population's GFP fluorescence (arbitrary units, a.u.) for the No Feedback constructs. Inset table reports median fluorescence intensity relative to isogenic plasmid encoding wild type LexA (rel. MFI). Statistics were performed against the rel. MFI of the plasmid-encoded wild type LexA strain (*, p < 0.001 in t-test; ◆, p < 0.05 in Dunn's test). (C) Flow cytometry data as in panel C but with the Feedbackconstructs. (D) Survival curves of the No Feedback constructs determined from the number of colony forming units (cfu's) able to form on LB-agar plates containing increasing concentrations of the DNA damaging agent mitomycin C. Inset table corresponds to mean survival (cfu's/ml, × 105) at 2 μg/ml (dashed box). Statistics were performed against isogenic plasmid encoding wild type Ptrc-lexA (*, p < 0.05 in t-test; ◆, p < 0.05 in Dunn's test). Error bars represent SEM of ≥7 replicates. (E) Mitomycin Csurvival curves for the Feedback constructs. Statistics were performed against against isogenic plasmid encoding wild type PlexA-lexA (*, p < 0.05 in t-test; ◆, p < 0.05 in Dunn's test). Error bars represent SEM of ≥6 replicates. See also Figure S1 and Table S1.
Fig. 2
Fig. 2
Transit to distant branches of LexA family sequence space requires negative feedback. (A) LexA family tree with highlighted branches containing the R157E (indigo) or I123A (gold) substitutions relative to E. coli LexA sequence (asterisk). Outer ring labels correspond to branches of Firmicutes (Firm.) and Actinobacteria (Actino.) phyla with the Proteobacteria phylum further divided into classes (gamma, beta and alpha). (B) Western blot of soluble, whole-cell lysate from the indicated LexA mutants. Blots were cut at ~37 kD and probed separately with either anti-GroEL (top, to determine differences in loading density) or anti-LexA antibody (bottom). Mean densitometry values relative to the corresponding wild type LexA plasmids are reported below the blots. Statistics were performed against the isogenic plasmid encoding wild type LexA (*, p < 0.001 in t-test; ◆, p < 0.05 in Dunn's test) across at least four biological replicates. (C) Flow cytometry data showing fluorescence intensity (arbitrary units, a.u.) of the wild type, mutant or isogenic empty vector populations without feedback. Inset table reports median fluorescence intensity relative to isogenic plasmid encoding wild type LexA (rel. MFI). Statistics were performed against the rel. MFI of the plasmid-encoded wild type LexA strain (*, p < 0.001 in t-test; ◆, p < 0.05 in Dunn's test). (D) Flow cytometry data as in panel C but with the negative feedback constructs. (E) Survival curves for each Ptrc-LexA construct against the DNA damaging agent mitomycin C with inset tables reporting the mean surviving colony forming units (cfu's/ml, × 105) observed in the boxed region (2 μg/ml). Statistics were performed against the isogenic plasmid encoding wild type LexA (*, p < 0.05 in t-test; ◆, p < 0.05 in Dunn's test). Error bars represent SEM of ≥6 replicates. (F) Survival curves as in panel E but with the negative feedback constructs. See also Figure S2 and Table S2.
Fig. 3
Fig. 3
Modeling the effect of negative feedback on sensitivity to changing system parameters. (A) A schematic model for the LexA transcriptional circuit includes LexA levels (L), production rate (αlexA), degradation/dilution rate (βLexA) and repression level (KlexA). (B) Analytical results for the parameter sensitivity of L with respect to βLexA in the presence (blue line) or absence (red line) of negative feedback showing reduced sensitivity of the negative feedback system to changes in relative LexA concentrations (L/KlexA). (C) Schematic model of a LexA circuit without feedback. (D) Transcriptional circuit of a reporter gene (gfp) fused to the sulA promoter that is repressed by LexA. (E) Analytical results for the parameter sensitivity of GFP levels (G) with respect to βLexA in the presence (blue line) or absence (red line) of negative feedback. See also Figure S3 and Table S3.
Fig. 4
Fig. 4
Feedback influences transcription factor sequence variation. Distributions of relative amino acid sequence divergence for prokaryotic negative feedback (blue) and positive feedback (orange) transcription factors are shown. Bins >1 contain bacterial transcription factor (TF) homologs more divergent than their target genes. Hollow histograms correspond to a randomization that redistributes each dataset equally to either side of 1. p values correspond to a Mann-Whitney U test between the sequence divergence dataset and the randomized dataset. Relative sequence divergences are shown for (A) LexA vs. RecA, (B) LysR vs. LysA, (C) MalI vs. MalXY, (D) AraC vs. AraE/AraFGH, (E) CdaR vs. GudD/GarLRK/GarD and (F) PhoB vs. PstSCABPhoU. See also Figure S4 and Table S4.

References

    1. Raj A, van Oudenaarden A. Stochastic gene expression and its consequences. Cell. 2008;135:216–226. - PMC - PubMed
    1. Barkai N, Leibler S. Robustness in simple biochemical networks. 1997:913–917. - PubMed
    1. Becskei A, Serrano L. Engineering stability in gene networks by autoregulation. Nature. 2000;405:590–593. - PubMed
    1. Bershtein S, Segal M, Bekerman R, Tokuriki N, Tawfik DS. Robustness-epistasis link shapes the fitness landscape of a randomly drifting protein. Nature. 2006;444:929–932. - PubMed
    1. Bershtein S, Goldin K, Tawfik DS. Intense neutral drifts yield robust and evolvable consensus proteins. J. Mol. Biol. 2008;379:1029–1044. - PubMed

Publication types

LinkOut - more resources