. 2014 Jun 26;7(6):1926-39.
doi: 10.1016/j.celrep.2014.05.021. Epub 2014 Jun 5.

Age-related dysfunction in mechanotransduction impairs differentiation of human mammary epithelial progenitors

Affiliations

Age-related dysfunction in mechanotransduction impairs differentiation of human mammary epithelial progenitors

Fanny A Pelissier et al. Cell Rep. .

Abstract

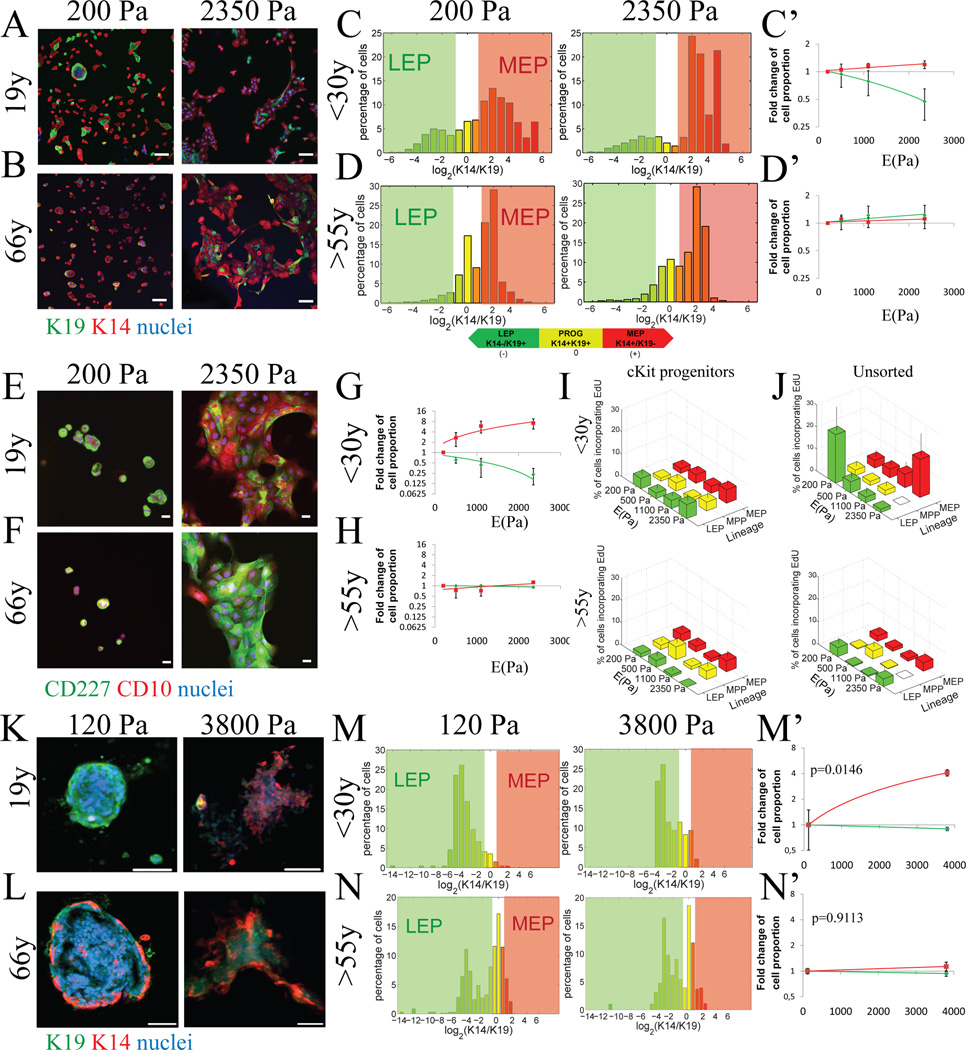
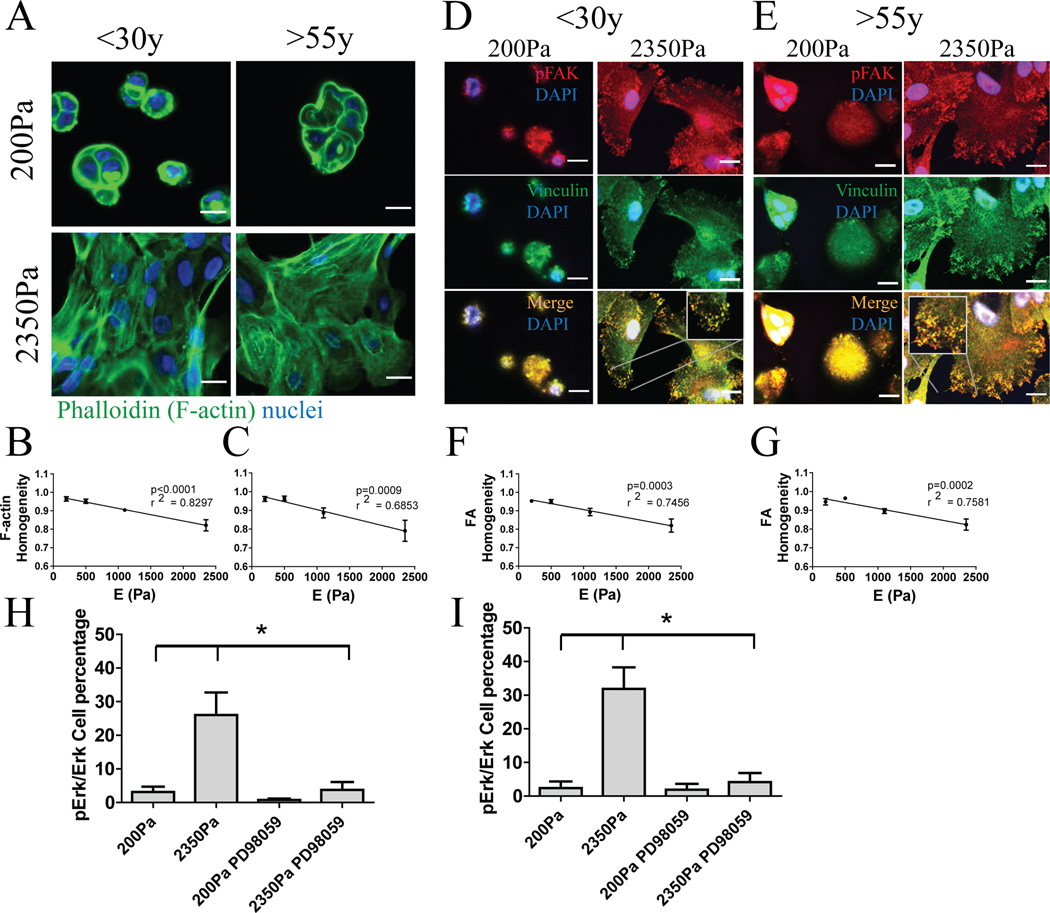
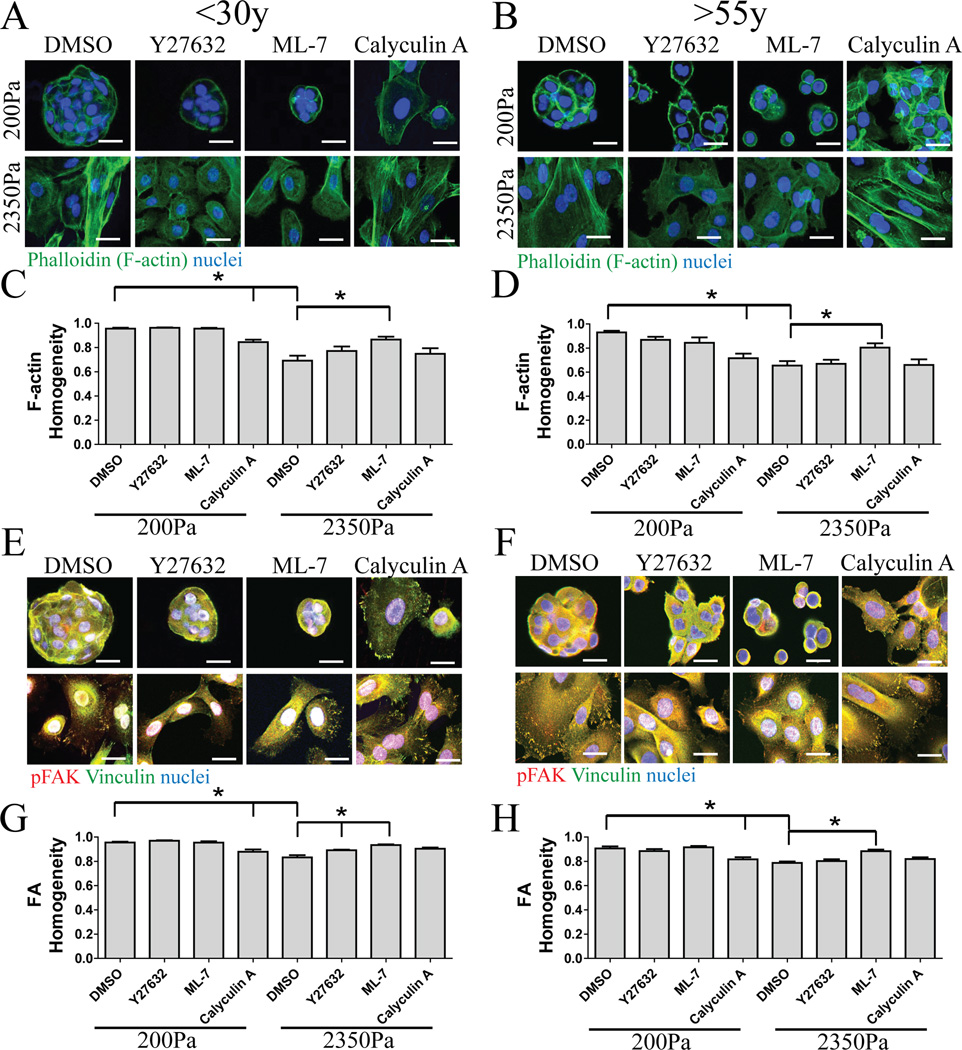
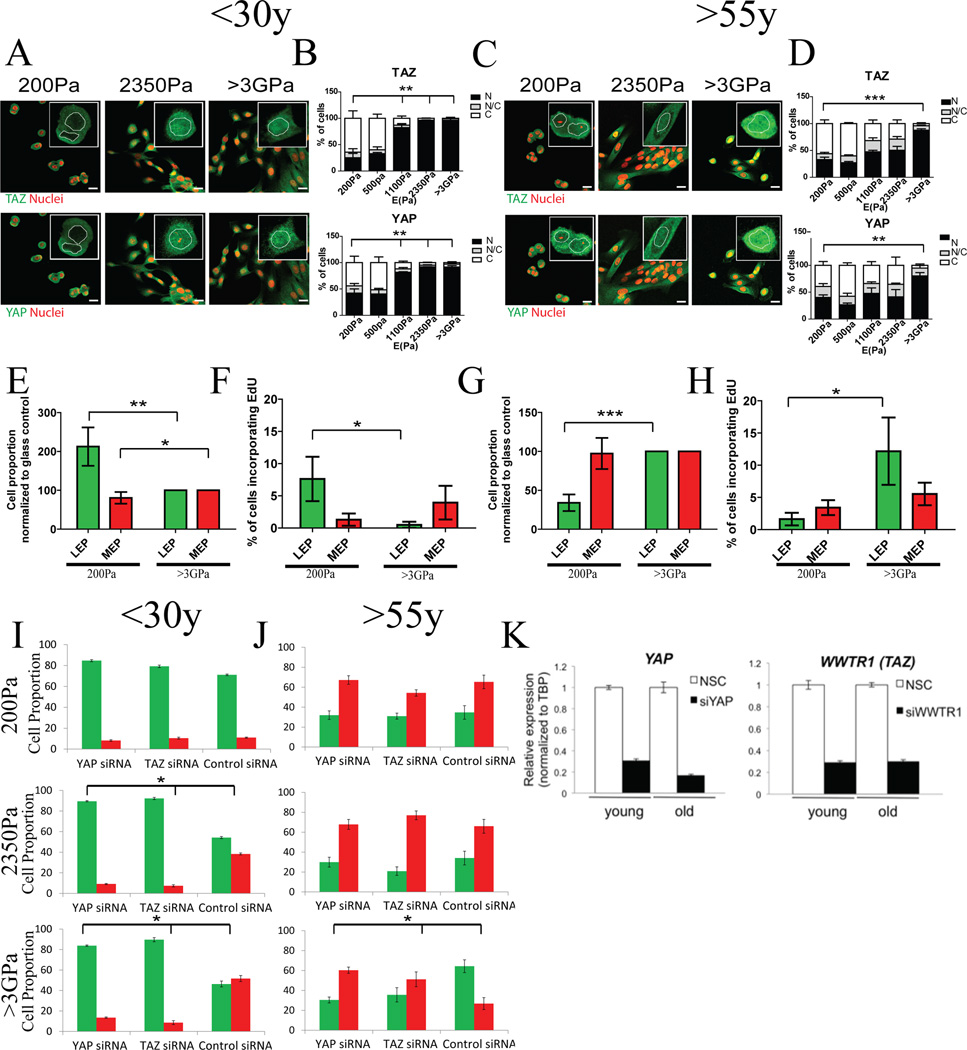
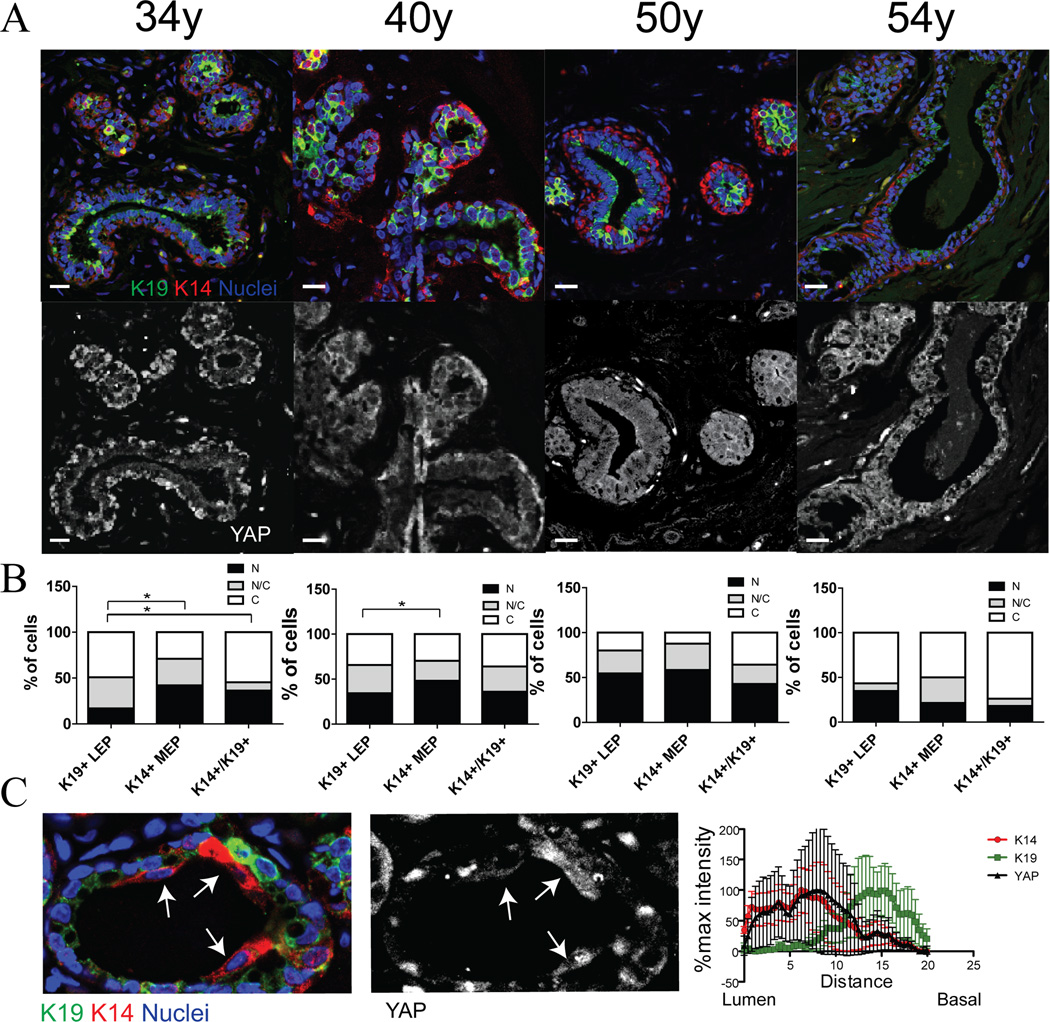
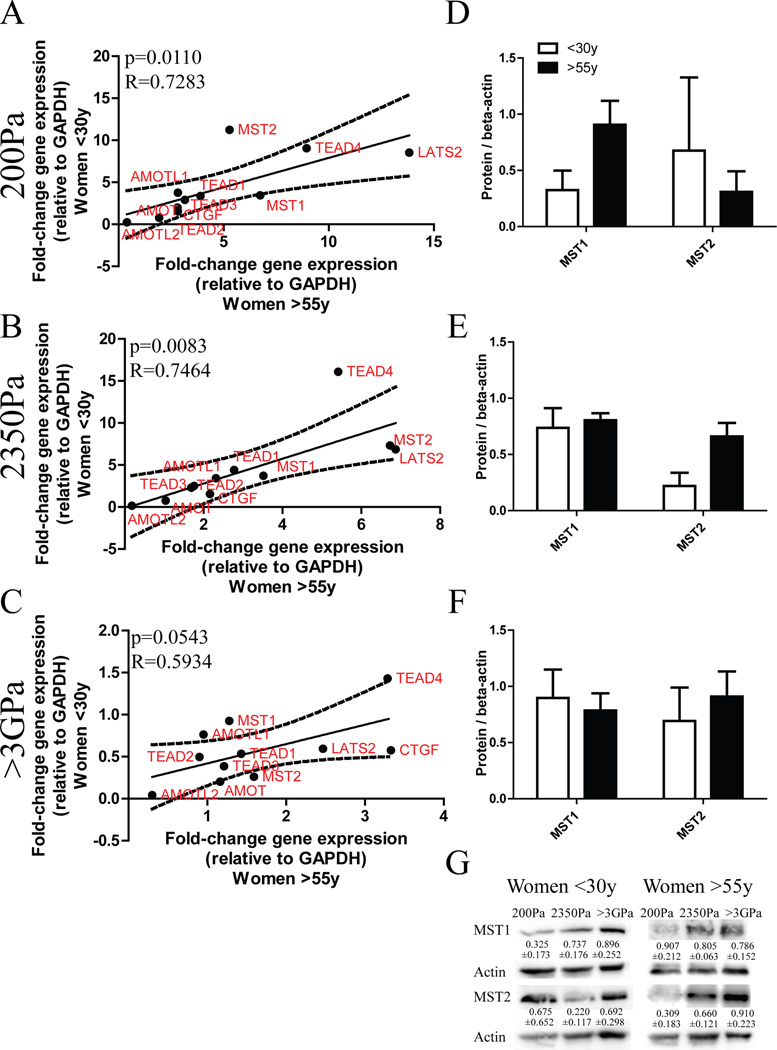
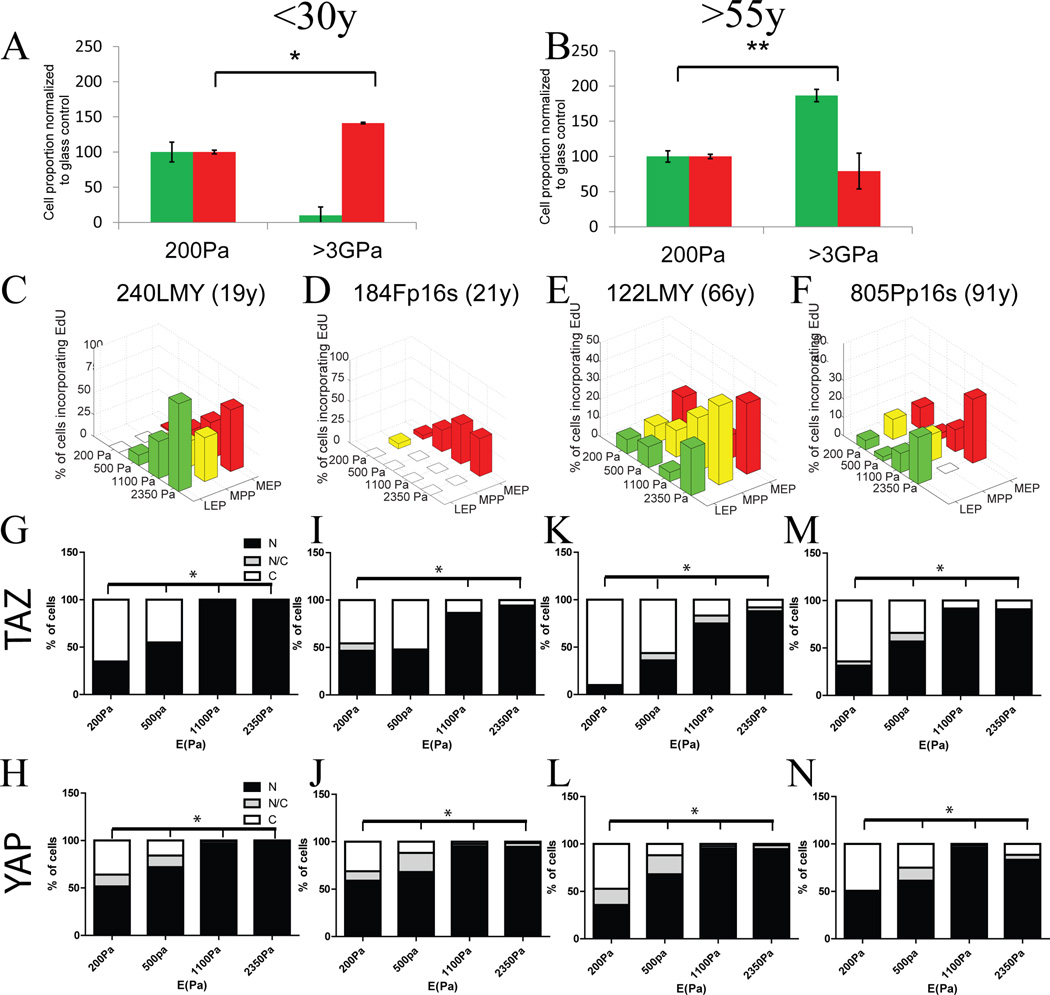
Dysfunctional progenitor and luminal cells with acquired basal cell properties accumulate during human mammary epithelial aging for reasons not understood. Multipotent progenitors from women aged <30 years were exposed to a physiologically relevant range of matrix elastic modulus (stiffness). Increased stiffness causes a differentiation bias towards myoepithelial cells while reducing production of luminal cells and progenitor maintenance. Lineage representation in progenitors from women >55 years is unaffected by physiological stiffness changes. Efficient activation of Hippo pathway transducers YAP and TAZ is required for the modulus-dependent myoepithelial/basal bias in younger progenitors. In older progenitors, YAP and TAZ are activated only when stressed with extraphysiologically stiff matrices, which bias differentiation towards luminal-like phenotypes. In vivo YAP is primarily active in myoepithelia of younger breasts, but localization and activity increases in luminal cells with age. Thus, aging phenotypes of mammary epithelia may arise partly because alterations in Hippo pathway activation impair microenvironment-directed differentiation and lineage specificity.


Figures

Figure 1
Figure 1. Aging alters differentiation patterns in response to substrate elastic modulus
Representative IF analysis of progenitors from young (240L, 19y) and (B) an older (122L, 66y) strains stained for K19 (green), K14 (red) and DAPI (blue) after 48h of culture on PA gels with increasing elastic modulus (E(Pa)). Bars represent 100µm. (C & D) Histograms represent log2-transformed ratios of K14 to K19 protein expression in single cells on 2D PA gels with increasing stiffness, histograms are heat mapped to indicate cells with the phenotypes of K14-/K19+ LEPs (green), K14+/K19+ progenitors (yellow), and K14+/K19-MEPs (red). Corresponding linear regression plots of LEP and MEP proportions as a function of modulus are shown for (C) women <30y (LEP p=0.0429, r2= 0.2086, MEP p=0.0475, r2= 0.2009 n=5) and (D’) women >55 (LEP p=0.4812, r2= 0.0296, MEP p=0.5138, r2= 0.0240, n=5). Regressions are fold change of lineage proportions compared to cKit+ on 200Pa condition ± s.e.m. (E) Representative IF analysis of progenitors from young (240L, 19y) and (F) an older (122L, 66y) strains stained for CD227 (green), CD10 (red) and DAPI (blue) after 48h of culture on PA gels with increasing elastic modulus. Bars represent 20µm. (G) Linear regression of fold change of LEP (CD227+/CD10-) and MEP (CD227-/CD10+) proportions as function of elastic modulus in women <30y (LEP p=0.0080, r2= 0.5219, MEP p=0.0198, r2= 0.4340 n=3) and (H) women >55y (LEP p=0.4689, r2= 0.0536, MEP p=0.1937, r2= 0.5219, n=3). Linear regressions are of fold change of lineage proportions normal to 200Pa condition ± s.e.m. Percentage of cells incorporating EdU as function of lineages and stiffness in (I) cKit+ HMEC and (J) unsorted HMEC (MEP from women <30y linear regression p=0.0270, r2=0.9467, LEP from women <30y t-test 200Pa vs 2350Pa p=0.0153, n=5). Data are means ± s.e.m. (K and L) Representative immunofluorescence of K19 (green), K14 (red) and DAPI (blue) of passage 1 cKit+ HMEC from a 19y and a 65y woman after 7 days of culture encapsulated in 3D hyaluronic acid (HA) gels. Bars represent 20nm. (M and N) Histograms represent log2-transformed ratios of K14 to K19 protein expression in single cells in 3D HA gels, histograms are heat mapped to indicate cells with the phenotypes of K14-/K19+ LEPs (green), K14+/K19+ progenitors (yellow), and K14+/K19- MEPs (red). (M’ and N’) Fold changes of lineage proportions normal to 120Pa condition (Chi-squared test women <30y p=0.0146, women >55y p=0.9113). See also Figure S2, S3, S4 and Table S2.
Figure 2
Figure 2. Mechano-sensing apparatuses function independently of age to generate actin stress fibers, focal adhesions, and ERK activation
(A) Representative immunofluorescence of F-actin (green) in cKit+ HMEC from a young strain (240L, 19y) and an older strain (122L, 66y) on PA gels of increasing stiffness. (B and C) Image quantification of F-actin homogeneity using feature detection (B, p<0.0001 and r2=0.8297, slope= −6,805e-5 ± 9,749e-6, n=3; C, p<0.001 and r2=0.6853, slope=-8,454e-5 ± 1,811e-5, n=3). The slopes are not significantly different (p=0.5699). Representative immunofluorescence images of pFAK (red) and vinculin (green), which overlapped (yellow), from confocal microscopy are shown in cKit+ HMEC from (D) a young strain (240L 19y) and (E) an older strain (122L 66y). Cells are shown at the substrata interface. Bars represent 20µm. (F and G) Image quantification of vinculin and pFAK homogeneity (F, p<0.001 and r2=0.7456, slope=-6,512e-5 ± 1,203e-5, n=3; G, p<0.001 and r2=0.7581, slope=-6,356e-5 ± 1,136e-5, n=3). The slopes are not significantly different (p=0.8124). Data are means ± s.e.m. (H and I) Ratio of pERK positive to ERK positive cell number in cKit+ HMEC from <30y (n=3) and >55y (n=3) strains on 200Pa and 2350Pa.
Figure 3
Figure 3. Perturbations of actinomyosin regulators elicit parallel mechano-sensing phenotypes in progenitors from young and old age groups
(A and B) Representative immunofluorescence of F-actin with phalloidin (green) in cKit+ HMEC from (A) a young strain (240L, 19y) and (B) an older strain (122L, 66y). Image quantification of F-actin homogeneity in (C) younger cKit+ (n=3) and (D) older cKit+ (n=3). Merged images of immunofluorescence of pFAK (red) and vinculin (green), overlap is (yellow), in cKit+ HMEC from (E) the young strain and (F) the older strain. Bars represent 20µm. Image quantification of vinculin and pFAK homogeneity in (G) young cKit+ (n=3) and (H) older cKit (n=3). See also figure S5.
Figure 4
Figure 4. YAP and TAZ activation are altered during aging
Representative immunofluorescence of TAZ (red), YAP (green), and DAPI (blue) in cKit+ HMEC from (A) a young strain (240L, 19y) and (C) an older strain (353P, 72y). Bars represent 20µm. Bar plots represent the distribution of YAP and TAZ (N: predominantly in the nucleus, N/C: equally distributed, C: predominantly in the cytoplasm) from over 100 cells/strain in (B) younger (n=3) and (D) older (n=3) strains. K19+LEP and K14+MEP proportions derived from cKit+ HMEC from (E) younger (n=5) and (G) older (n=5) women. Data are fold change of cell proportions compared to glass control ± s.e.m. Percentage of EdU+ LEP and MEP derived from cKit+ HMEC from (F) younger (n=5) and (H) older (n=5) women. Data are means ± s.e.m. K19+LEP and K14+MEP proportions derived from cKit+ HMEC from (I) younger and (J) older strains transfected with YAP or TAZ siRNA. (K) Bar graphs of YAP and TAZ transcript knockdown following siRNA treatment, NSC scrambled control siRNA.
Figure 5
Figure 5. YAP localization changes with age in vivo
(A) Representative immunofluorescence of K14 (red), K19 (green), YAP (white) and DAPI (blue) in human mammary breast sections from four women (aged 34y, 40y, 50y, 54y). Bars represent 20µm. (B) Bar plots represent the distribution of YAP (N: predominantly in the nucleus, N/C: equally distributed, C: predominantly in the cytoplasm) from over 100 cells/woman. (C) YAP signal isolation from the immunofluorescence of K14 (red), K19 (green), YAP (white) and DAPI (blue) from the 34y woman. Arrows identify luminal-positioned K14+/K19low/- cells. The line graph shows mean pixel intensities from the lumen to the basal side of the structure in 10 different examples of K14+ luminal cells. See also Figure S6.
Figure 6
Figure 6. Age-dependent patterns of Hippo pathway components
Correlation of gene expression between cKit+ HMEC from younger (n=3) and older (n=3) strains after 24h on (A) 200Pa (p=0.0110, R=0.7283) (B) 2350Pa PA gels (p=0.0083, R=0.7464) and (C) >3GPa substrate (p=0.0543, R=0.5934). Data are normalized to GAPDH expression. Western blot densitometric analysis of MST1 and MST2 from cKit+ HMEC from younger (n=3) and older (n=3) strains after 24h on (D) 200Pa, (E) 2350Pa PA gels and (F) >3GPa substrate. Data are normalized to beta-actin protein content and are mean ± s.e.m. (G) Representative western blot with quantification from a young (240L, 19y) and an older strain (122L, 66y).
Figure 7
Figure 7. Immortalization restores responsiveness to physiological stiffness in older HMEC
K19+LEP and K14+MEP proportions derived from immortalized cell lines from (A) younger (p=0.0111, n=2 individuals in triplicate) and (B) older (p=0.0056, n=2 individuals in triplicate) women. Data are fold change of cell proportions compared to glass control ± s.e.m. (C–F) Percentage of cells from immortalized cell lines derived from primary strains (240LMY at passage 25, 184Fp16s at passage 31, 122LMY at passage 19 and 805Pp16s at passage 29) incorporating EdU as a function of lineage, as defined by K14 and K19 expression, and stiffness. (G–N) Bar plots represent the distribution of YAP and TAZ (N: predominantly in the nucleus, N/C: equally distributed, C: predominantly in the cytoplasm) from over 100 cells/lineage in immortalized cell lines. By comparison to the other cell lines, 184F derivatives are known to be mainly basal at the expense of LEP and progenitor See also Figure S7.

References

    1. Ananthanarayanan B, Kim Y, Kumar S. Elucidating the mechanobiology of malignant brain tumors using a brain matrix-mimetic hyaluronic acid hydrogel platform. Biomaterials. 2011;32:7913–7923. - PMC - PubMed
    1. Beningo KA, Dembo M, Kaverina I, Small JV, Wang YL. Nascent focal adhesions are responsible for the generation of strong propulsive forces in migrating fibroblasts. The Journal of cell biology. 2001;153:881–888. - PMC - PubMed
    1. Benz CC. Impact of aging on the biology of breast cancer. Critical reviews in oncology/hematology. 2008;66:65–74. - PMC - PubMed
    1. Bershadsky AD, Balaban NQ, Geiger B. Adhesion-dependent cell mechanosensitivity. Annual review of cell and developmental biology. 2003;19:677–695. - PubMed
    1. Cancer Genome Atlas N. Comprehensive molecular portraits of human breast tumours. Nature. 2012;490:61–70. - PMC - PubMed

Publication types