. 2014 Jun 26;7(6):2031-2041.
doi: 10.1016/j.celrep.2014.05.020. Epub 2014 Jun 6.

MtDNA segregation in heteroplasmic tissues is common in vivo and modulated by haplotype differences and developmental stage

Affiliations

MtDNA segregation in heteroplasmic tissues is common in vivo and modulated by haplotype differences and developmental stage

Joerg Patrick Burgstaller et al. Cell Rep. .

Abstract

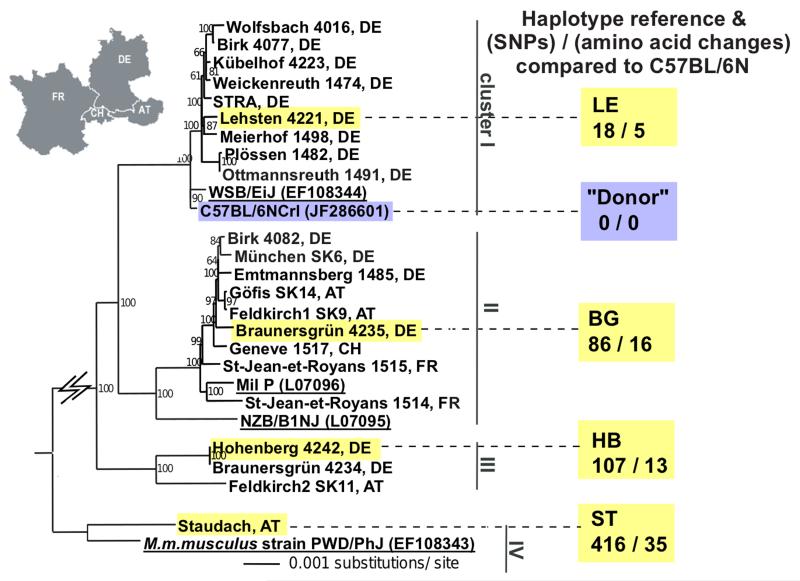
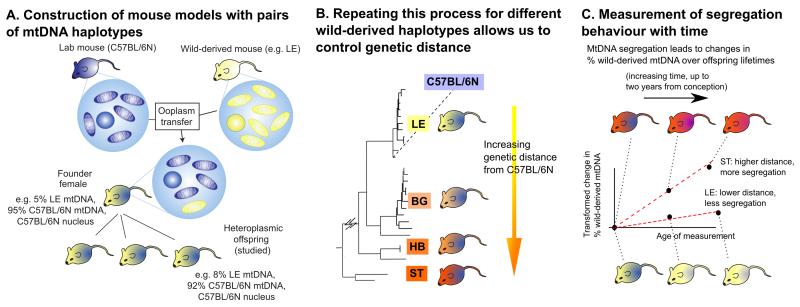
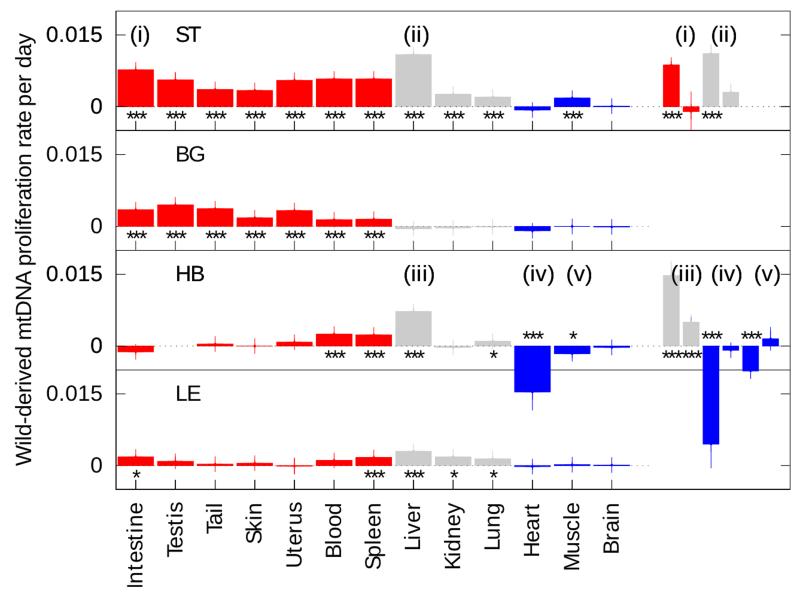
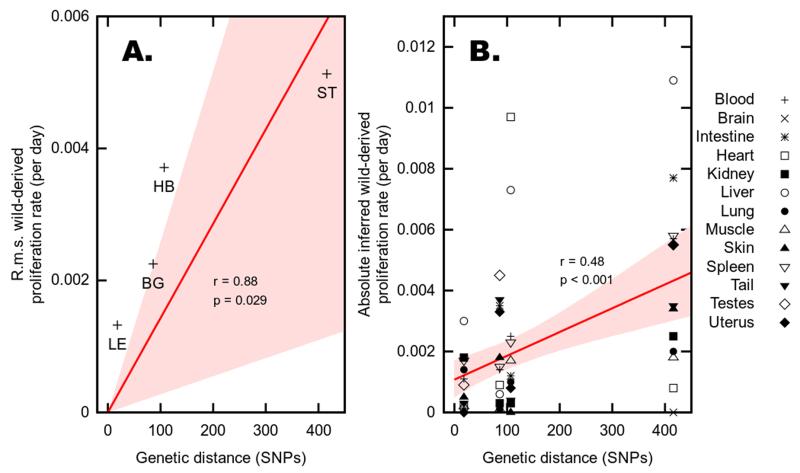
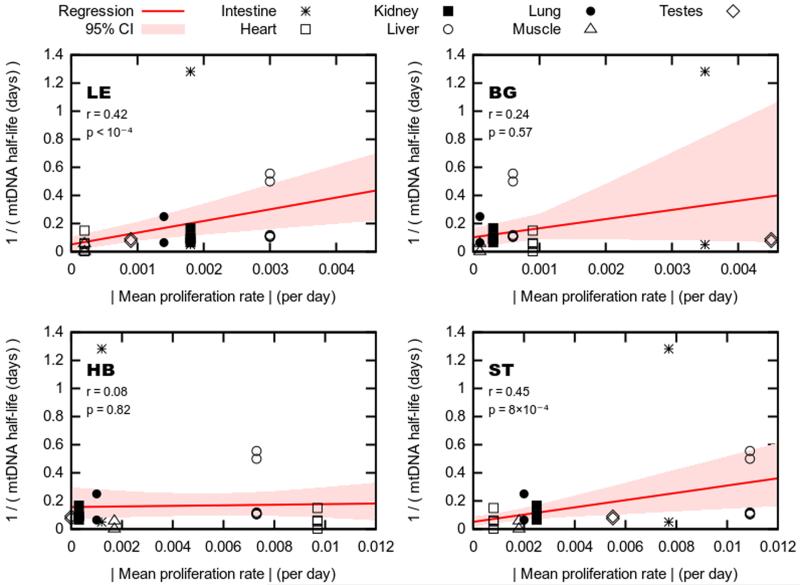
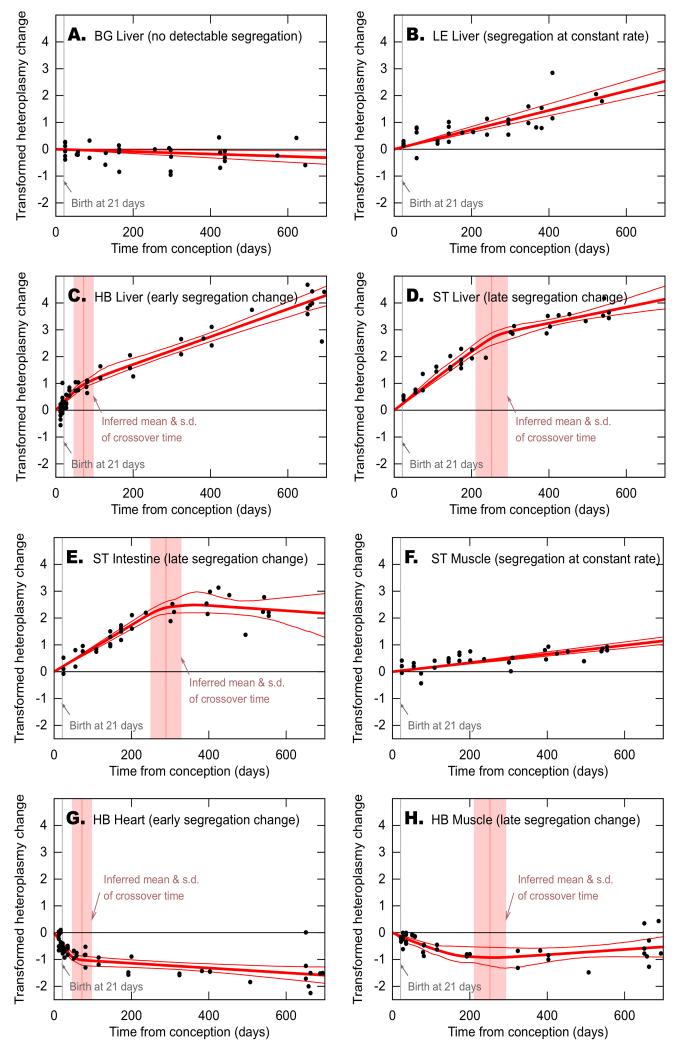
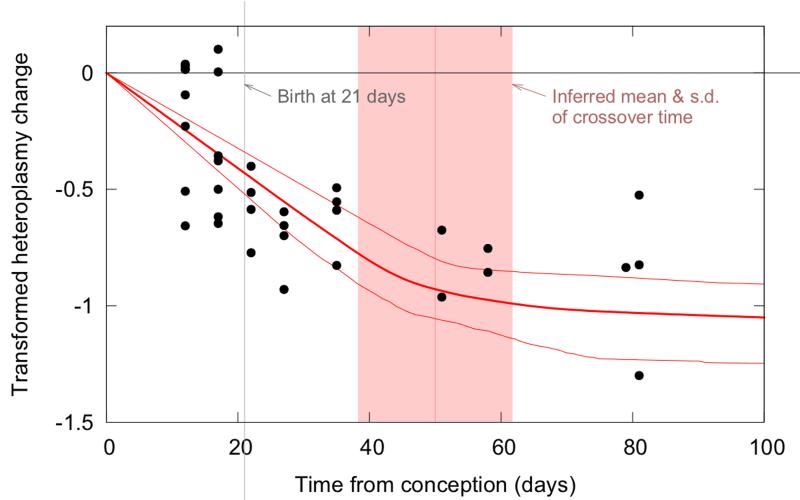
The dynamics by which mitochondrial DNA (mtDNA) evolves within organisms are still poorly understood, despite the fact that inheritance and proliferation of mutated mtDNA cause fatal and incurable diseases. When two mtDNA haplotypes are present in a cell, it is usually assumed that segregation (the proliferation of one haplotype over another) is negligible. We challenge this assumption by showing that segregation depends on the genetic distance between haplotypes. We provide evidence by creating four mouse models containing mtDNA haplotype pairs of varying diversity. We find tissue-specific segregation in all models over a wide range of tissues. Key findings are segregation in postmitotic tissues (important for disease models) and segregation covering all developmental stages from prenatal to old age. We identify four dynamic regimes of mtDNA segregation. Our findings suggest potential complications for therapies in human populations: we propose "haplotype matching" as an approach to avoid these issues.


Figures

Figure 1
Figure 1. Neighbour-joining phylogenetic analysis of 22 novel mitochondrial genomes of wild-derived house mice
The mtDNA genomes of 22 wild-derived mice (M. m. domesticus) captured in four countries cluster into three groups, with the different subspecies M. m. musculus as an additional cluster (cluster IV). Black: wild-derived mice; yellow highlighted: wild-derived mice used to generate the four heteroplasmic mouse models in this study; black and underlined: reference laboratory strains with GenBank accession number bracketed; blue highlighted: C57BL/6N (B6N) “donor” laboratory mouse. The country of origin of the mouse is designated by a two-letter code (AT: Austria, FR: France, DE: Germany, CH: Switzerland). Support values for the internal branches of the tree topology are shown as percentages. The number of SNPs and amino acid changes calculated relative to the B6N reference mtDNA are shown below the four lines (LE, BG, HB, ST). See also Table S1.
Figure 2
Figure 2. Creation and measurement of wild-derived heteroplasmic mouse lines with diverse mtDNA haplotypes
(A) Founder females were created by ooplasmic injection from a wild-derived mouse (yellow) into a zygote of a standard laboratory mouse (C57BL/6N (B6N), blue). Only offspring of the founder females were used in this study, to avoid artefacts associated with the creation process. (B) This process was repeated for each of four wild-derived mtDNA haplotypes (LE pictured) to achieve a range of genetic differences between haplotype pairs, allowing us to address for the first time the effect of mtDNA diversity on segregation. (C) To compute segregation rates, levels of the wild-derived mtDNA haplotype were measured in many mice from each lineage at different ages. Our inferential machinery allows us to compute the change in levels of the wild-derived haplotype since conception, and recording this heteroplasmy change as a function of the age of the measured mouse allows us to infer segregation rate in each tissue in each lineage.
Figure 3
Figure 3. mtDNA segregation rates across tissues, in correlation to cell-turnover
The mean proliferation rate for each wild-derived mtDNA haplotype (see Figure 1 for their definition, Tables S2-9 for raw data) is reported across tissues, with the standard deviation of the associated bootstrapped distribution (vertical lines). Positive values indicate relative increase of the respective wild-derived mtDNA over time, negative values relative increase of C57BL/6N (B6N) mtDNA (y-axis). Tissues are coloured according to mitotic rate: (left, red) highly mitotic; (centre, grey) mitotic; (right, blue) post-mitotic (details in Table S10). Cases where the segregation rate significantly differs from zero are reported (bootstrapping with the percentile method; * p < 0.05, ** p < 0.01, *** p < 0.001 after Bonferroni correction). n.d., not determined. While in ST almost all tissues show increase of wild-derived mtDNA, in BG this happens only in self-renewing tissues with high cell-turnover (red). HB shows complex segregation pattern that includes a decrease of wild-derived mtDNA in heart and muscle. LE is the haplotype most closely related to B6N, and nevertheless shows significant segregation in several tissues, possibly resembling ST haplotype at a slower segregation rate. (i) to (v) denote tissues where the magnitude of the proliferation rate was significantly higher in younger than older animals. Each of (i)-(v) is re-plotted as an inset, early segregation rate on the left, late on the right (likelihood ratio test, p < 0.01 after Bonferroni correction). See also Figure 6. (n= 31; 34; 56; 33 for LE; BG; HB; ST respectively) See also Figure S1 and Tables S2-9.
Figure 4
Figure 4. Correlation between genetic distance and segregation
The proliferation rate of wild derived haplotypes correlates with the genetic distance between haplotypes both as root-mean-square (r.m.s) over all tissues (A) and between tissues (B). (A) Increasing genetic distance leads to increase of the wild-derived mtDNA, measured over all tissues. Genetic distance between haplotypes (in number of SNPs) is shown against r.m.s. proliferation rates of wild-derived mtDNA across all tissues. Regression line and shaded region (red) show a linear model fit with zero intercept (as identical haplotypes experience no proliferative difference) and 95% confidence intervals. p-value is reported against the null hypothesis of zero gradient (i.e. a horizontal regression line). (B) Increasing genetic distance leads to increase of the wild-derived mtDNA, measured as individual tissues. Genetic distance between haplotypes (in number of SNPs) is shown against wild-derived proliferation rate in each tissue. Regression line and shaded region (red) show linear model fit and 95% confidence intervals; p-value is reported against the null hypothesis of no correlation (i.e. a horizontal regression line).
Figure 5
Figure 5. Correlation between mtDNA turnover and mtDNA segregation rate
Measurements on mtDNA half-life in different tissues amalgamated from across the literature (y-axis; for raw data see Table S10) against wild-derived proliferation rate in each tissue (x-axis), for each haplotype pair. Regression lines (red) show a linear model fit relating proliferation and turnover measurements; shaded regions (red) give 95% confidence intervals on this fit. p-values are reported against the null hypothesis of no relationship (i.e. corresponding to a horizontal line). Two mtDNA haplotypes (ST, LE) show significant correlation between mtDNA turnover (half-life) and speed of segregation in the respective tissues. Only tissues for which mtDNA turnover data was available in the literature were included in the analysis. See also Table S 10.
Figure 6
Figure 6. Segregation regimes vary based on haplotype and tissue
Black dots are experimental data of single mice; dark red lines show mean and 95% confidence intervals of inferred segregation trajectories. In the models where there appears to be a bi-phasic timecourse vertical light pink lines show mean and standard deviation of inferred crossover time between two different segregation speeds. The y-axis shows transformed heteroplasmy change, giving the segregation rate of wild-derived mtDNA. Positive values indicate relative increase of the respective wild-derived mtDNA, negative values relative increase of the C57BL/6N (B6N) mtDNA. In BG liver (A), no significant segregation is observed (zero heteroplasmy change lies within the confidence intervals). In LE liver (B) and ST muscle (F) segregation occurs at constant rates, leading to single gradients of heteroplasmy changes with time. In other tissues pictured, there is statistical support (likelihood ratio test, p < 0.01 after Bonferroni) for a dynamic regime involving fast segregation before a certain crossover time and slower segregation after this time. In HB liver (C) and heart (G), this crossover time is inferred to be during the growth phase of the mice (day 72 ±26 and 50 ±12 respectively); in ST liver (D) and intestine (E), and HB muscle (H), the crossover time is much later in life (day 252 ±42, 289 ±40 and 227 ±57 respectively), possibly due to physiological and metabolic changes at these times. (n= 31; 34; 56; 33 for LE; BG; HB; ST respectively)
Figure 7
Figure 7. Tissue-specific mtDNA segregation starts prenatally in HB heart
New-born and juvenile HB mice already show very low levels of HB mtDNA in heart compared to other tissues. Additional analysis of 15 fetuses (left of the grey vertical line indicating birth at 21 days after conception) confirms that reduction of HB mtDNA (and increase of C57BL/6N (B6N) mtDNA) starts already prenatally. Black dots are experimental data of single mice; dark red lines show mean and 95% confidence intervals of inferred segregation trajectories. Vertical light pink lines show mean and standard deviation of inferred crossover time between two different segregation speeds. The y-axis shows transformed heteroplasmy change, giving the proliferation rate of HB mtDNA. Positive values indicate relative increase of HB mtDNA, negative values relative increase of the B6N mtDNA.

References

    1. Acton BM, Lai I, Shang X, Jurisicova A, Casper RF. Neutral mitochondrial heteroplasmy alters physiological function in mice. Biol Reprod. 2007;77:569–576. - PubMed
    1. Battersby BJ, Loredo-Osti JC, Shoubridge EA. Nuclear genetic control of mitochondrial DNA segregation. Nat Genet. 2003;33:183–186. - PubMed
    1. Battersby BJ, Shoubridge EA. Selection of a mtDNA sequence variant in hepatocytes of heteroplasmic mice is not due to differences in respiratory chain function or efficiency of replication. Hum Mol Genet. 2001;10:2469–2479. - PubMed
    1. Battersby BJ, Shoubridge EA. Reactive oxygen species and the segregation of mtDNA sequence variants. Nat Genet. 2007;39:571–572. author reply 572. - PubMed
    1. Blanco R, Mayordomo E, Montoya J, Ruiz-Pesini E. Rebooting the human mitochondrial phylogeny: an automated and scalable methodology with expert knowledge. BMC Bioinformatics. 2011;12:174. - PMC - PubMed

Publication types

Substances

Associated data

LinkOut - more resources