Detailed localization of augmented angiotensinogen mRNA and protein in proximal tubule segments of diabetic kidneys in rats and humans
- PMID: 24910532
- PMCID: PMC4046880
- DOI: 10.7150/ijbs.8450
Detailed localization of augmented angiotensinogen mRNA and protein in proximal tubule segments of diabetic kidneys in rats and humans
Abstract
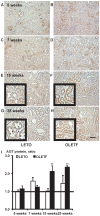
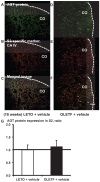
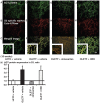
In the intrarenal renin-angiotensin system, angiotensinogen levels are well known to be increased in diabetes, and these enhanced intrarenal angiotensinogen levels may initiate the development and accelerate the progression of diabetic nephropathy. However, the specific localization of the augmented angiotensinogen in proximal tubule segments in diabetes is still unknown. We investigated the detailed localization of angiotensinogen in 3 proximal tubule segments in the diabetic Otsuka Long-Evans Tokushima fatty (OLETF) rats and the control Long-Evans Tokushima Otsuka (LETO) rats. We also prepared OLETF rats treated with angiotensin II type 1 receptor blocker, olmesartan or with a combination of vasodilator agents. Moreover, biopsied samples of human kidney cortex were used to confirm the results of animal studies. We examined the co-localization of angiotensinogen with segment-specific markers by double staining using fluorescence in situ hybridization and/or immunofluorescence. Angiotensinogen mRNA expression was barely detectable in segment 1. In segment 3, the area of angiotensinogen mRNA expression was augmented in the OLETF rats compared with the LETO rats. Angiotensinogen protein expression areas in segments 1 and 3 were also increased in the OLETF rats compared with the LETO rats. Chronic treatment with olmesartan ameliorated these areas of augmented angiotensinogen expression. Biopsied human kidney samples showed similar results. These data suggest that the augmented angiotensinogen mRNA levels in segment 3 and angiotensinogen protein levels in segments 1 and 3 may contribute to the progression of diabetic nephropathy.
Keywords: angiotensin II receptor blocker; angiotensinogen; diabetic nephropathy; proximal tubule; renin-angiotensin system..
Conflict of interest statement
Competing Interests: The authors have declared that no competing interest exists.
Figures


Similar articles
-
Aberrant activation of the intrarenal renin-angiotensin system in the developing kidneys of type 2 diabetic rats.Horm Metab Res. 2013 May;45(5):338-43. doi: 10.1055/s-0032-1331256. Epub 2013 Jan 15. Horm Metab Res. 2013. PMID: 23322513 Free PMC article.
-
Divergent localization of angiotensinogen mRNA and protein in proximal tubule segments of normal rat kidney.J Hypertens. 2012 Dec;30(12):2365-72. doi: 10.1097/HJH.0b013e3283598eed. J Hypertens. 2012. PMID: 23032142 Free PMC article.
-
Olmesartan ameliorates a dietary rat model of non-alcoholic steatohepatitis through its pleiotropic effects.Eur J Pharmacol. 2008 Jul 7;588(2-3):316-24. doi: 10.1016/j.ejphar.2008.04.028. Epub 2008 Apr 16. Eur J Pharmacol. 2008. PMID: 18501344
-
Proximal tubule angiotensinogen modulation of arterial pressure.Curr Opin Nephrol Hypertens. 2013 Jan;22(1):32-6. doi: 10.1097/MNH.0b013e328359dbed. Curr Opin Nephrol Hypertens. 2013. PMID: 23010762 Free PMC article. Review.
-
Augmented intrarenal and urinary angiotensinogen in hypertension and chronic kidney disease.Pflugers Arch. 2013 Jan;465(1):3-12. doi: 10.1007/s00424-012-1143-6. Epub 2012 Aug 24. Pflugers Arch. 2013. PMID: 22918624 Free PMC article. Review.
Cited by
-
Effects of Olmesartan and Azilsartan on Albuminuria and the Intrarenal Renin-Angiotensin System.World J Res Rev. 2018 Jan;6(1):7-10. World J Res Rev. 2018. PMID: 29683146 Free PMC article.
-
Blockade of sodium-glucose cotransporter 2 suppresses high glucose-induced angiotensinogen augmentation in renal proximal tubular cells.Am J Physiol Renal Physiol. 2020 Jan 1;318(1):F67-F75. doi: 10.1152/ajprenal.00402.2019. Epub 2019 Nov 4. Am J Physiol Renal Physiol. 2020. PMID: 31682172 Free PMC article.
-
Angiotensin II biphasically regulates cell differentiation in human iPSC-derived kidney organoids.Am J Physiol Renal Physiol. 2021 Nov 1;321(5):F559-F571. doi: 10.1152/ajprenal.00134.2021. Epub 2021 Aug 27. Am J Physiol Renal Physiol. 2021. PMID: 34448643 Free PMC article.
-
α-Ketoglutarate Upregulates Collecting Duct (Pro)renin Receptor Expression, Tubular Angiotensin II Formation, and Na+ Reabsorption During High Glucose Conditions.Front Cardiovasc Med. 2021 Jun 4;8:644797. doi: 10.3389/fcvm.2021.644797. eCollection 2021. Front Cardiovasc Med. 2021. PMID: 34179130 Free PMC article.
-
High Basolateral Glucose Increases Sodium-Glucose Cotransporter 2 and Reduces Sirtuin-1 in Renal Tubules through Glucose Transporter-2 Detection.Sci Rep. 2018 May 1;8(1):6791. doi: 10.1038/s41598-018-25054-y. Sci Rep. 2018. PMID: 29717156 Free PMC article.
References
-
- Castrop H, Hocherl K, Kurtz A, Schweda F, Todorov V, Wagner C. Physiology of kidney renin. Physiol Rev. 2010;90:607–673. - PubMed
-
- B Burns KD, Hiremath S. Urinary angiotensinogen as a biomarker of chronic kidney disease: ready for prime time? Nephrol Dial Transplant. 2012;27:3010–3013. - PubMed
-
- Ogawa S, Kobori H, Ohashi N, Urushihara M, Nishiyama A, Mori T. et al. Angiotensin II Type 1 Receptor Blockers Reduce Urinary Angiotensinogen Excretion and the Levels of Urinary Markers of Oxidative Stress and Inflammation in Patients with Type 2 Diabetic Nephropathy. Biomark Insights. 2009;4:97–102. - PMC - PubMed
Publication types
MeSH terms
Substances
Grants and funding
LinkOut - more resources
Full Text Sources
Other Literature Sources
Medical
Molecular Biology Databases

