

doi: 10.1111/j.1750-8606.2010.00129.x.
Modeling Variability in Individual Development: Differences of degree or kind?
Affiliations
- PMID: 24910711
- PMCID: PMC4045646
- DOI: 10.1111/j.1750-8606.2010.00129.x
Item in Clipboard
Modeling Variability in Individual Development: Differences of degree or kind?
Child Dev Perspect.
.
Abstract
The proper use of statistical models for analyzing individual change over time is critical for the progress of developmental science. Latent curve models, hierarchical linear growth models, group-based trajectory models, and growth mixture models constitute increasingly important tools for longitudinal data analysis. To facilitate their understanding and use, this paper clarifies similarities and differences between these models, with particular attention to the assumptions they make about individual development. An example shows how the results and interpretation vary across model types. Discussion centers on reviewing the strengths and limitations of each approach for developmental research.
Figures
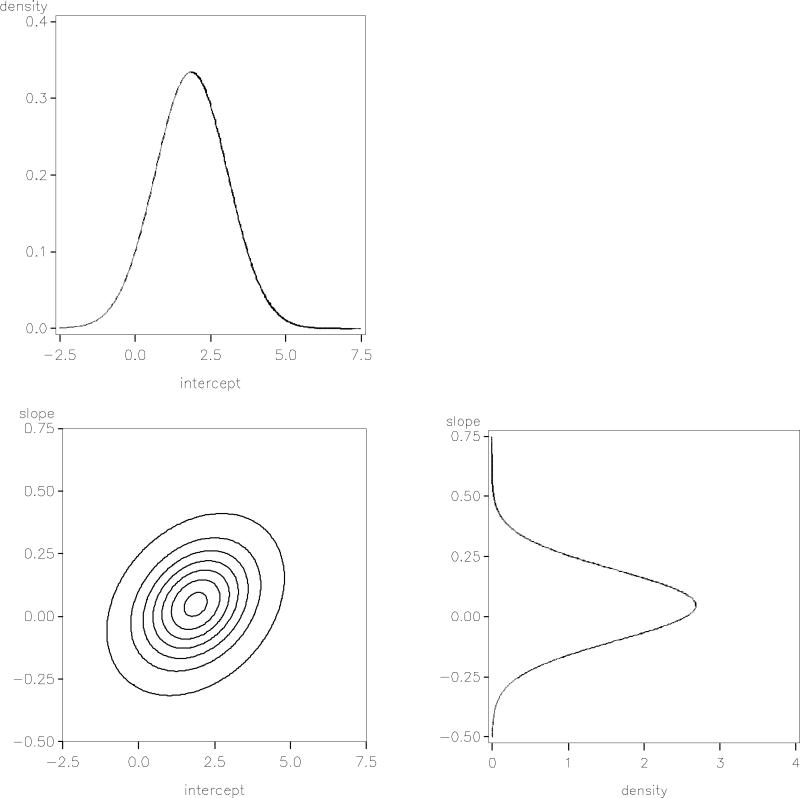
Univariate and bivariate normal distributions for trajectory parameters implied by Approach 1 (bivariate distribution depicted via a contour plot)
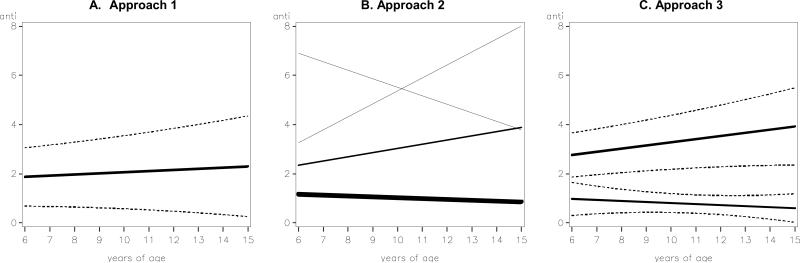
Model-implied trajectories. A: Approach 1 (mean ±1 sd); B: Approach 2 (trajectory width proportional to class size); C: Approach 3 (mean ± 1 sd for each class).
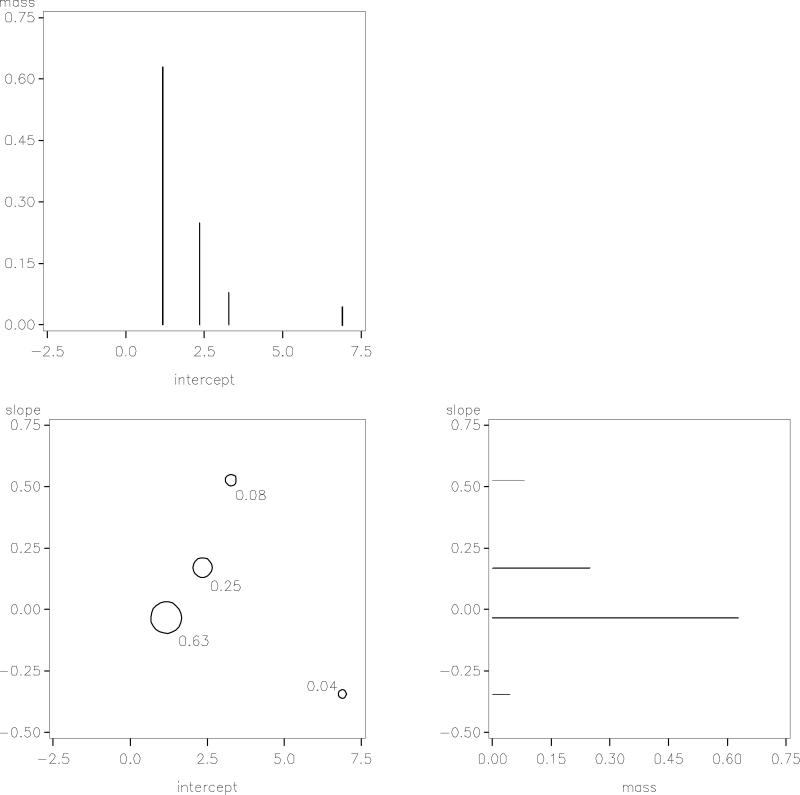
Univariate and bivariate discrete distributions for trajectory parameters implied by Approach 2 (4 classes; bivariate distribution depicted via a bubble plot with bubble size proportional to class size; the proportion of the population within the class is indicated adjacent to the bubble).
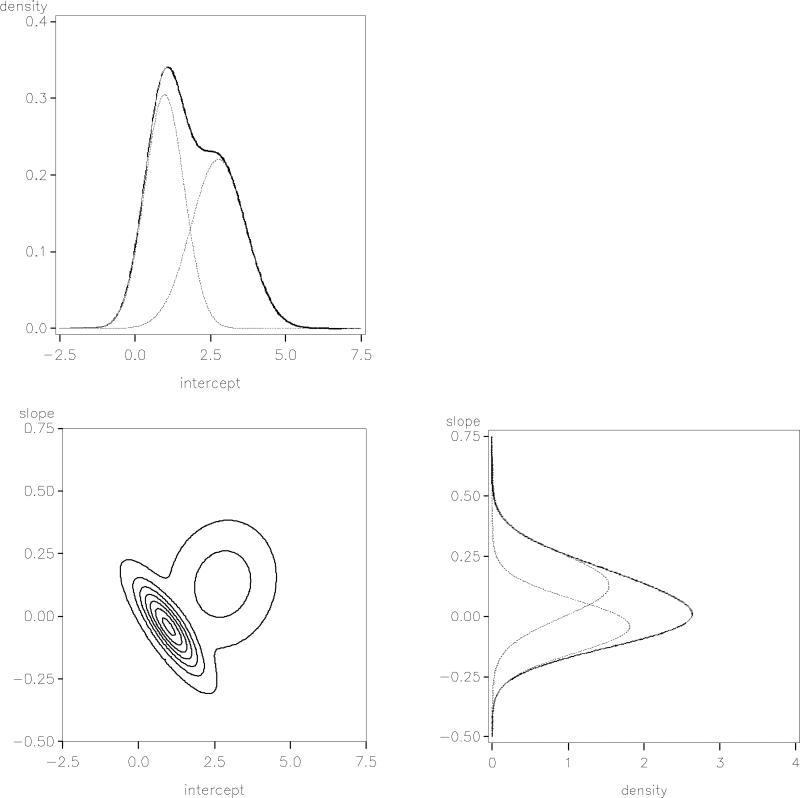
Univariate and bivariate normal mixture distributions for trajectory parameters implied by Approach 3 (2 classes; bivariate distribution depicted via a contour plot)
References
-
- Bauer DJ. Observations on the use of growth mixture models in psychological research. Multivariate Behavioral Research. 2007;42:757–786.
-
- Bauer DJ, Curran PJ. Distributional assumptions of growth mixture models: Implications for overextraction of latent trajectory classes. Psychological Methods. 2003a;8(3):338–363. - PubMed
-
- Bauer DJ, Curran PJ. Overextraction of latent trajectory classes: Much ado about nothing? Reply to Rindskopf (2003), Muthen (2003), and Cudeck and Henly (2003). Psychological Methods. 2003b;8(3):384–393. - PubMed
-
- Bollen KA, Curran PJ. Latent Curve Models: A Structural Equation Perspective. Wiley; Hoboken, N.J.: 2006.
-
- Bryk AS, Raudenbush SW. Application of hierarchical linear models to assessing change. Psychological Bulletin. 1987;101:147–158.
Grants and funding
LinkOut - more resources
Full Text Sources