

A novel matrix-similarity based loss function for joint regression and classification in AD diagnosis
- PMID: 24911377
- PMCID: PMC4138265
- DOI: 10.1016/j.neuroimage.2014.05.078
A novel matrix-similarity based loss function for joint regression and classification in AD diagnosis
Abstract
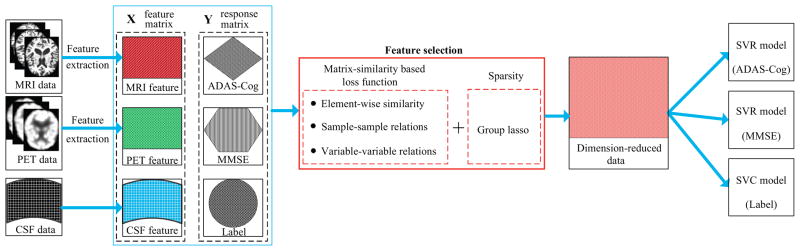
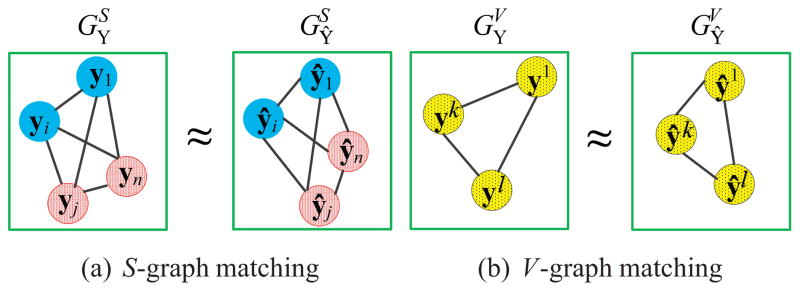
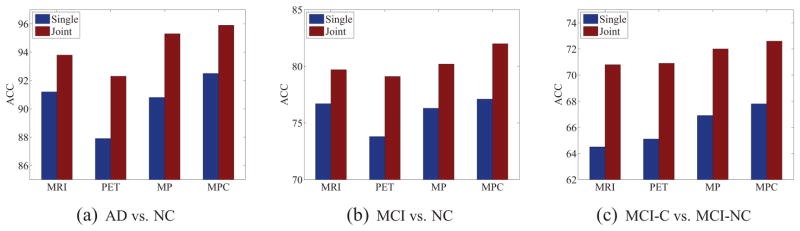
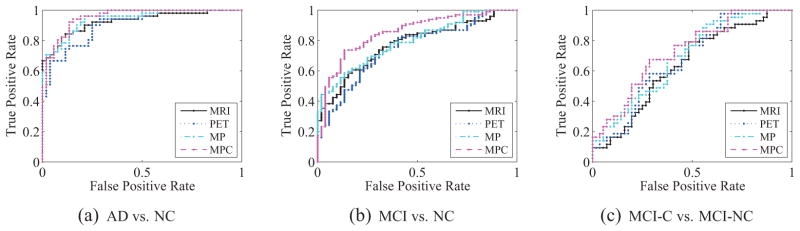
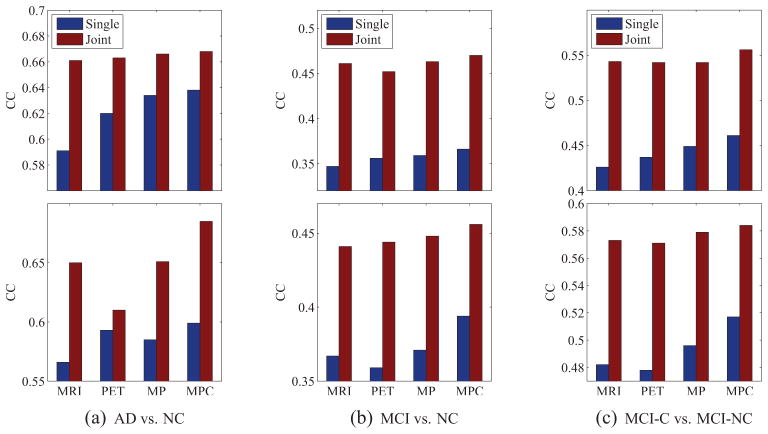
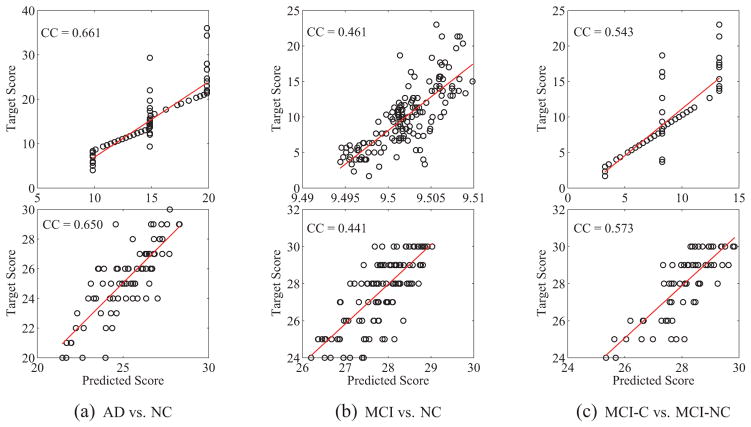
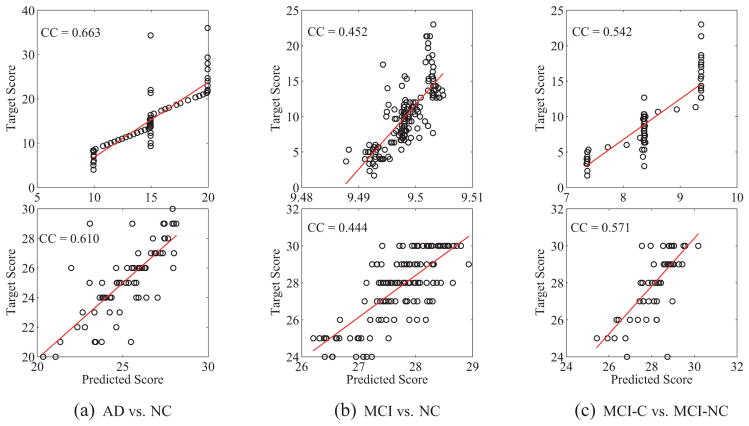
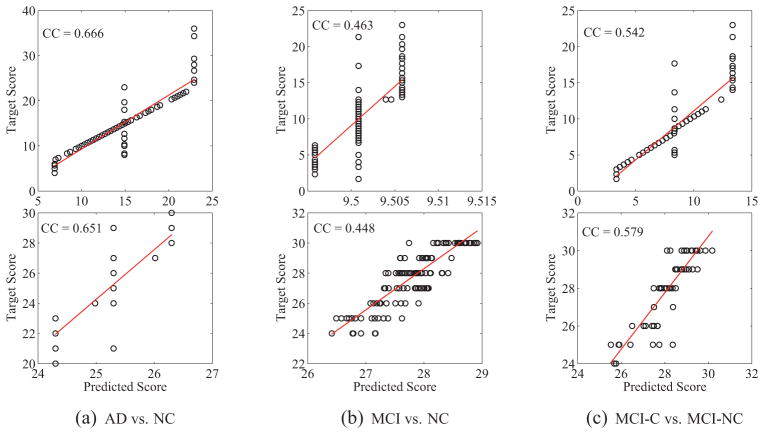
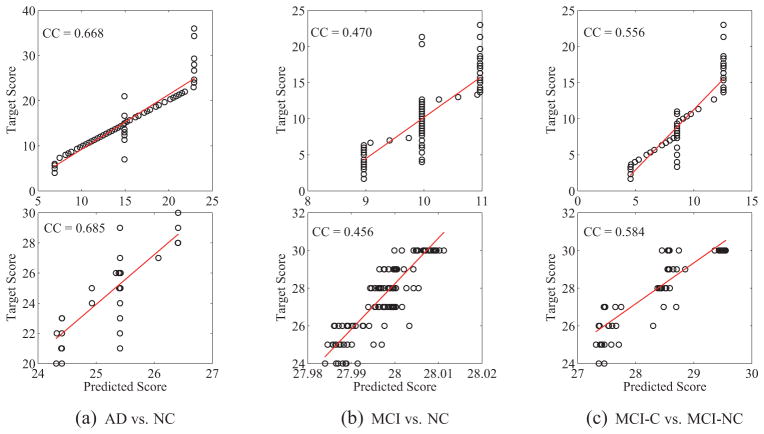
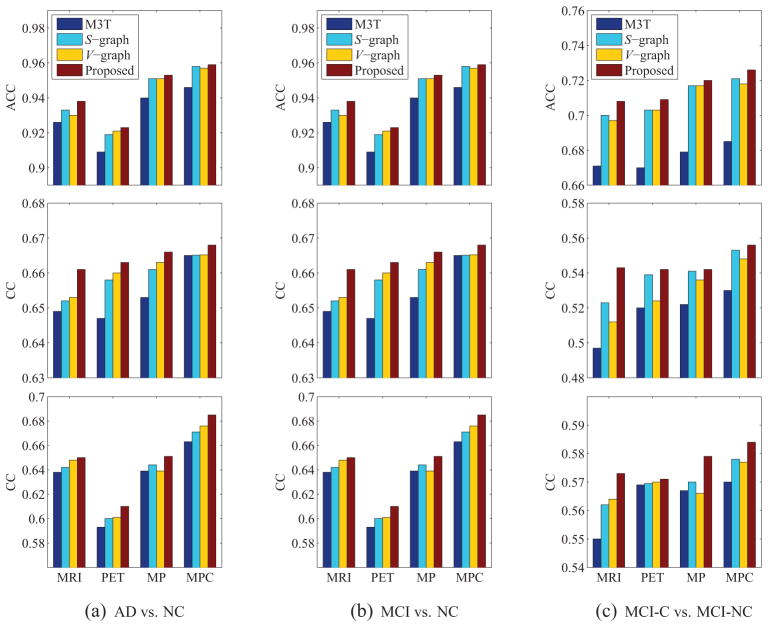
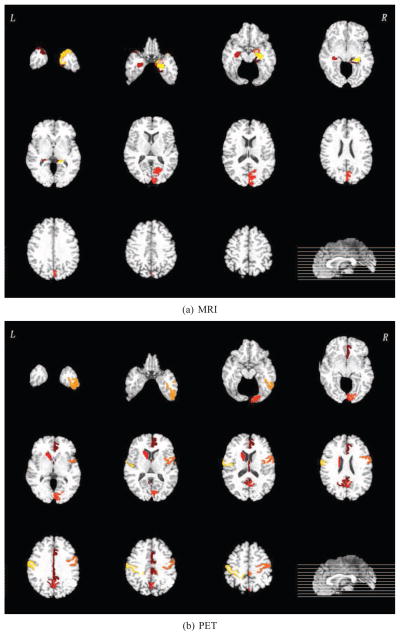
Recent studies on AD/MCI diagnosis have shown that the tasks of identifying brain disease and predicting clinical scores are highly related to each other. Furthermore, it has been shown that feature selection with a manifold learning or a sparse model can handle the problems of high feature dimensionality and small sample size. However, the tasks of clinical score regression and clinical label classification were often conducted separately in the previous studies. Regarding the feature selection, to our best knowledge, most of the previous work considered a loss function defined as an element-wise difference between the target values and the predicted ones. In this paper, we consider the problems of joint regression and classification for AD/MCI diagnosis and propose a novel matrix-similarity based loss function that uses high-level information inherent in the target response matrix and imposes the information to be preserved in the predicted response matrix. The newly devised loss function is combined with a group lasso method for joint feature selection across tasks, i.e., predictions of clinical scores and a class label. In order to validate the effectiveness of the proposed method, we conducted experiments on the Alzheimer's Disease Neuroimaging Initiative (ADNI) dataset, and showed that the newly devised loss function helped enhance the performances of both clinical score prediction and disease status identification, outperforming the state-of-the-art methods.
Keywords: Alzheimer's disease (AD); Feature selection; Joint sparse learning; Manifold learning; Mild Cognitive Impairment (MCI) conversion.
Copyright © 2014 Elsevier Inc. All rights reserved.
Figures
References
-
- Brookmeyer R, Johnson E, Ziegler-Graham K, Arrighi MH. Forecasting the global burden of Alzheimer’s disease. Alzheimer’s & dementia: the journal of the Alzheimer’s Association. 2007;3 (3):186–191. - PubMed
-
- Burges CJC. A tutorial on support vector machines for pattern recognition. Data Mining and Knowledge Discover. 1998;2 (2):121–167.
-
- Chételat G, Eustache F, Viader F, Sayette VDL, Pélerin A, Mézenge F, Hannequin D, Dupuy B, Baron JC, Desgranges B. FDG-PET measurement is more accurate than neuropsychological assessments to predict global cognitive deterioration in patients with mild cognitive impairment. Neurocase. 2005;11 (1):14–25. - PubMed
Publication types
MeSH terms
Grants and funding
LinkOut - more resources
Full Text Sources
Other Literature Sources
Medical
