. 2014 Jun 10;111(23):8685-90.
doi: 10.1073/pnas.1404616111. Epub 2014 May 27.

Mechanical constraints imposed by 3D cellular geometry and arrangement modulate growth patterns in the Arabidopsis embryo

Affiliations

Mechanical constraints imposed by 3D cellular geometry and arrangement modulate growth patterns in the Arabidopsis embryo

George W Bassel et al. Proc Natl Acad Sci U S A. .

Abstract

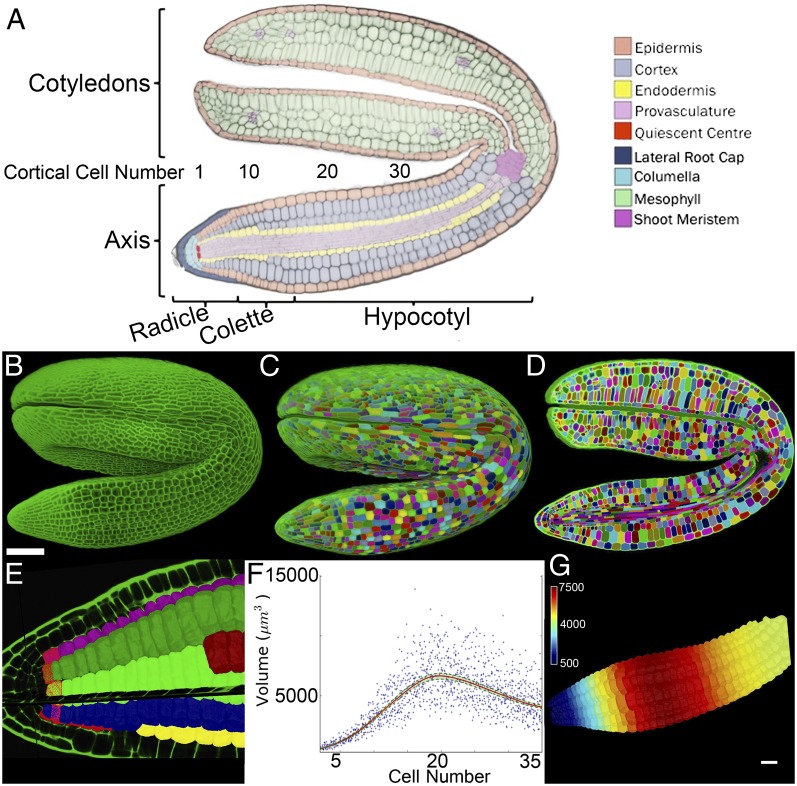
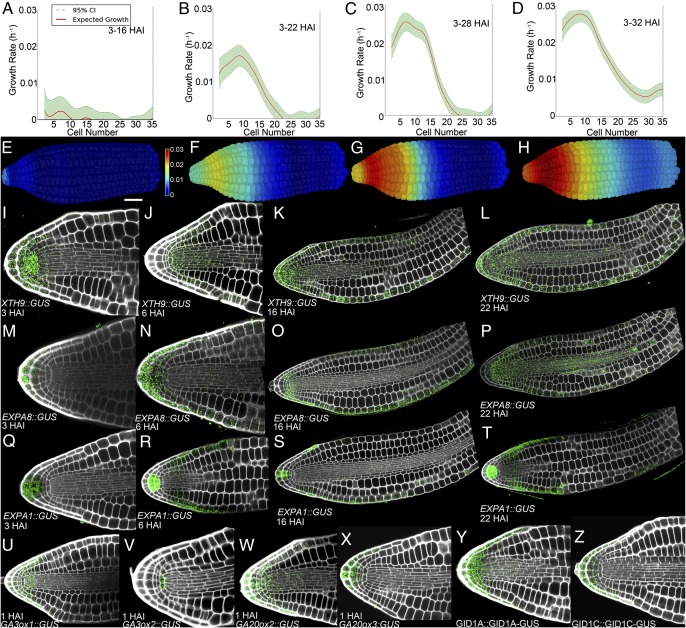
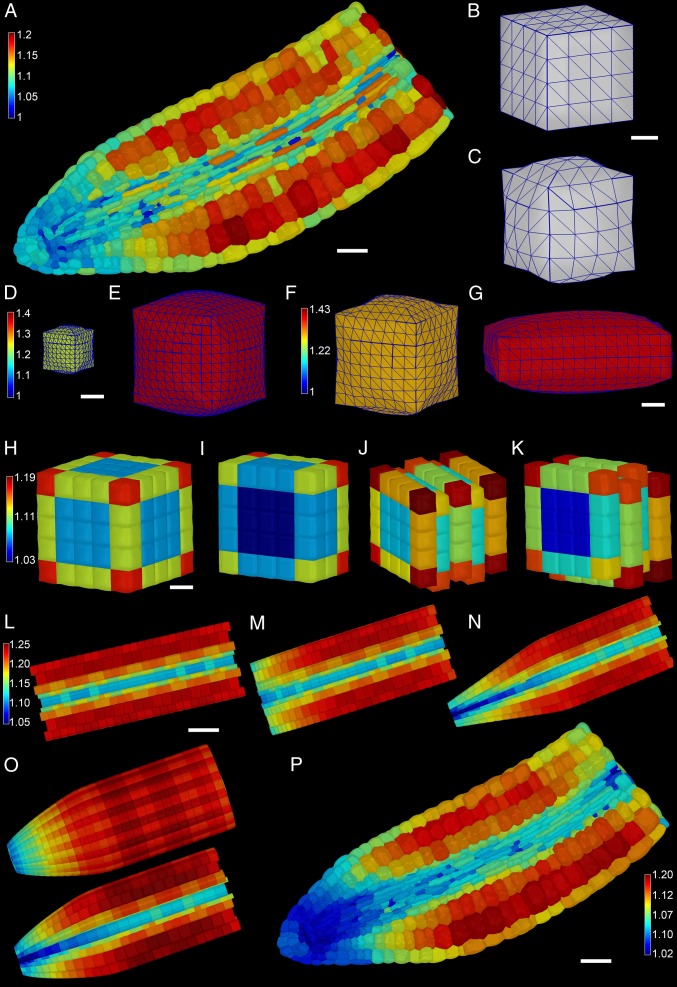
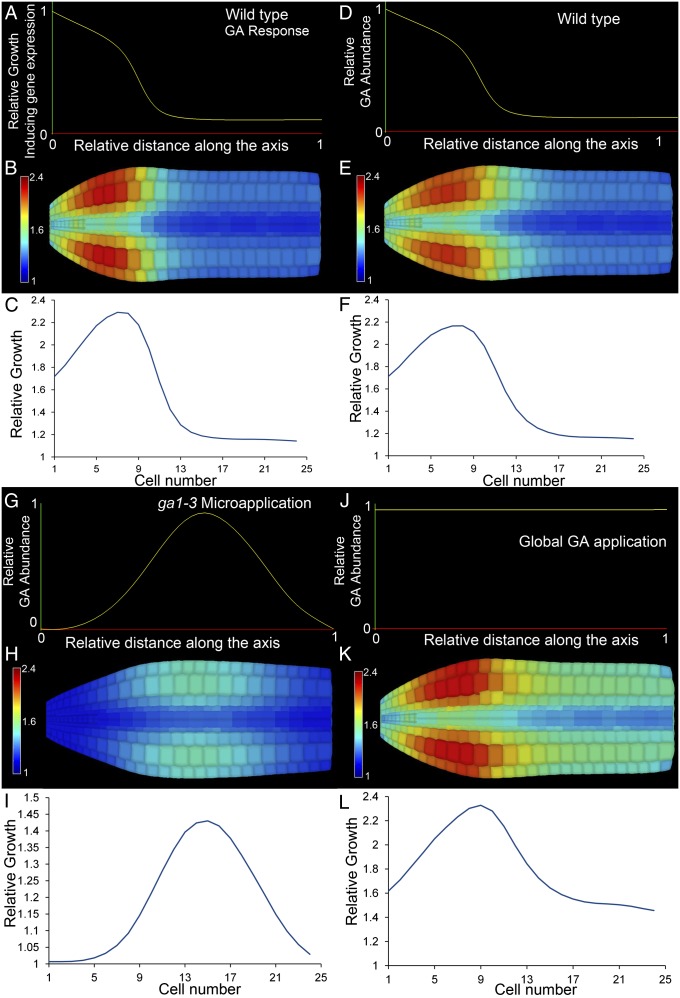
Morphogenesis occurs in 3D space over time and is guided by coordinated gene expression programs. Here we use postembryonic development in Arabidopsis plants to investigate the genetic control of growth. We demonstrate that gene expression driving the production of the growth-stimulating hormone gibberellic acid and downstream growth factors is first induced within the radicle tip of the embryo. The center of cell expansion is, however, spatially displaced from the center of gene expression. Because the rapidly growing cells have very different geometry from that of those at the tip, we hypothesized that mechanical factors may contribute to this growth displacement. To this end we developed 3D finite-element method models of growing custom-designed digital embryos at cellular resolution. We used this framework to conceptualize how cell size, shape, and topology influence tissue growth and to explore the interplay of geometrical and genetic inputs into growth distribution. Our simulations showed that mechanical constraints are sufficient to explain the disconnect between the experimentally observed spatiotemporal patterns of gene expression and early postembryonic growth. The center of cell expansion is the position where genetic and mechanical facilitators of growth converge. We have thus uncovered a mechanism whereby 3D cellular geometry helps direct where genetically specified growth takes place.

Keywords: biomechanics; computational modeling; plant development; quantification; seed germination.


Conflict of interest statement

The authors declare no conflict of interest.

Figures

Fig. 1.
Fig. 1.
Quantification of volumetric increases at specific cell positions. (A) Cellular anatomy of the mature dormant Arabidopsis embryo. (B) Maximum-intensity projection of a confocal z stack of a complete Arabidopsis embryo. (C) Three-dimensional segmentation of the embryo in B. Different colors are used to illustrate unique labels. (D) Cross section through the segmented embryo in C. (E) Virtual isolation of outer cortical cells each labeled along their linear cell files. Cortical cells at a defined position are selected (red cells) and the origin of cutting planes is positioned upon the quiescent center. (F) Plot of cortical cell volume by cell number along the embryo axis, using aggregated data from four individual samples. Cell 1 corresponds to the first cortical cell within the embryo radicle as indicated in A. The 95% confidence interval is indicated in green. (G) False-colored heat map upon the cortical cells of an embryo axis illustrating the output within the graph in F. (Scale bars: G, in μm3; B, 100 μm.)
Fig. 2.
Fig. 2.
Spatiotemporal pattern of gene expression and cell expansion during Arabidopsis seed germination. Graphs show relative cell expansion at (A) 3–16 HAI, (B) 3–22 HAI, (C) 3–28 HAI, and (D) 3–32 HAI. False-colored axes illustrate progressive relative cell expansion at (E) 3–16 HAI, (F) 3–22 HAI, (G) 3–28 HAI, and (H) 3–32 HAI. Cell expansion rates were determined using four embryos at each time point. (I–L) XTH9 promoter activity at (I) 3 HAI, (J) 6 HAI, (K) 16 HAI, and (L) 22 HAI. (M–P) EXPA8 promoter activity at (M) 3 HAI, (N) 6 HAI, (O) 16 HAI, and (P) 22 HAI. (Q–T) EXPA1 promoter activity at (Q) 3 HAI, (R) 6 HAI, (S) 16 HAI, and (T) 22 HAI. (U–X) Promoter activities of GA synthesis enzymes 1 h after imbibition in nondormant seeds of (U) GA3ox1::GUS, (V) GA3ox2::GUS, (W) GA20ox2::GUS, and (X) GA20ox3::GUS. (Y and Z) Protein localization of the GA receptors (Y) GID1A::GID1A-GUS and (Z) GID1C::GID1C-GUS in dormant embryos. The colored scale bar in E indicates growth rate. (White scale bar in E, 50 μm.)
Fig. 3.
Fig. 3.
Geometric constraints on cellular expansion, using 3D mechanical models. (A) Three-dimensional mechanical growth simulations using the real cellular geometry derived from an Arabidopsis embryo. (White scale bar, 30 μm.) Colored scale bar shows relative cell expansion. (B and C) An artificially designed square cuboid cell before pressurization (B) and following pressurization (C). (White scale bar in B, 5 mm.) (D and E) An 8,000-μm3 (D) and a 125,000-μm3 (E) cell each pressurized to 5 Bar and colored using the same scale shown in E. (White scale bar in D, 10 mm.) (F and G) A square cuboid (F) and rectangular cuboid (G) cell pressurized to 5 Bar and colored using the scale in F. (White scale bar in G, 5 μm.) (H) Surface view of the expansion of a 5 × 5 x 5 block of cells. (I) Inside view of H. (J) Same as H with the cells staggered one-half between adjacent cell layers. (K) Inside view of J. HK are colored using scale in H. (White scale bar in H, 20 μm.) (L) An artificially designed embryo shaped as a cylinder. (White scale bar, 50 μm.) (M) The same as L but with shorter cells toward the tip. (N) The same as L but with narrower cells toward the tip. (O) An artificially designed embryo where the cells get progressively shorter and narrower toward the tip, using the same parameters as in M and N, inclusive. The colored scale bar in L indicates relative growth rate, and LO have the same scale. (P) Actual embryo template geometry heat map colored showing changes in surface area. (White scale bar, 30 μm.)
Fig. 4.
Fig. 4.
Growing 3D FEM simulation of embryo cell expansion in response to the observed growth gene expression gradient. (A) Function used to define the GA signaling output. (B) False-colored axis showing relative cell expansion along the wild-type embryo axis. (C) Graph of relative cortical cell expansion in the embryo in B. GA receptor abundance in DL used the same function as in A. (D) GA abundance in the wild-type embryo. (E) False-colored axis showing relative cell expansion along the embryo axis in D. (F) Graph of relative cortical cell expansion in the embryo in E. (G) GA abundance in ga1-3 embryos with GA microapplied. (H) False-colored axis of relative cell expansion from G. (I) Graph of relative cortical cell expansion in the embryo in H. (J) GA abundance in ga1-3 embryos with GA applied globally. (K) False-colored axis showing relative cell expansion from J. (L) Graph of relative cortical cell expansion in the embryo in K.

References

    1. Kennaway R, Coen E, Green A, Bangham A. Generation of diverse biological forms through combinatorial interactions between tissue polarity and growth. PLoS Comput Biol. 2011;7(6):e1002071. - PMC - PubMed
    1. Coen E, Rolland-Lagan AG, Matthews M, Bangham JA, Prusinkiewicz P. The genetics of geometry. Proc Natl Acad Sci USA. 2004;101(14):4728–4735. - PMC - PubMed
    1. Kuchen EE, et al. Generation of leaf shape through early patterns of growth and tissue polarity. Science. 2012;335(6072):1092–1096. - PubMed
    1. Green AA, Kennaway JR, Hanna AI, Bangham JA, Coen E. Genetic control of organ shape and tissue polarity. PLoS Biol. 2010;8(11):e1000537. - PMC - PubMed
    1. Sauret-Güeto S, Schiessl K, Bangham A, Sablowski R, Coen E. JAGGED controls Arabidopsis petal growth and shape by interacting with a divergent polarity field. PLoS Biol. 2013;11(4):e1001550. - PMC - PubMed

Publication types

Substances

LinkOut - more resources