

Performance comparison of four exome capture systems for deep sequencing
- PMID: 24912484
- PMCID: PMC4092227
- DOI: 10.1186/1471-2164-15-449
Performance comparison of four exome capture systems for deep sequencing
Abstract
Background: Recent developments in deep (next-generation) sequencing technologies are significantly impacting medical research. The global analysis of protein coding regions in genomes of interest by whole exome sequencing is a widely used application. Many technologies for exome capture are commercially available; here we compare the performance of four of them: NimbleGen's SeqCap EZ v3.0, Agilent's SureSelect v4.0, Illumina's TruSeq Exome, and Illumina's Nextera Exome, all applied to the same human tumor DNA sample.
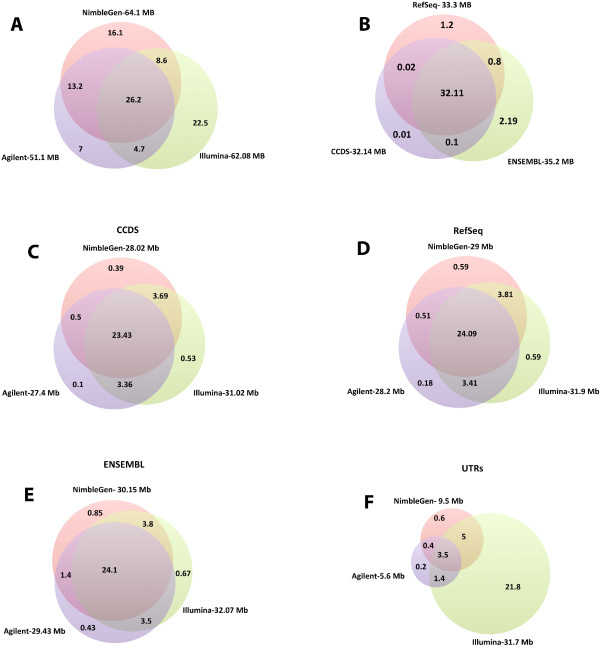
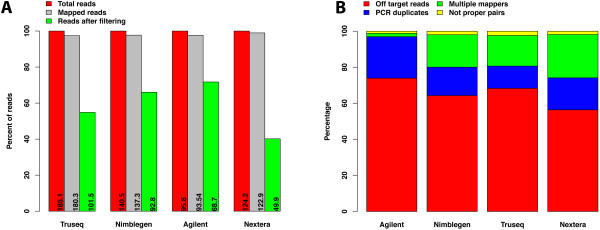
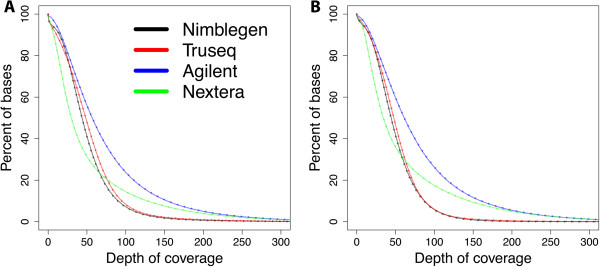
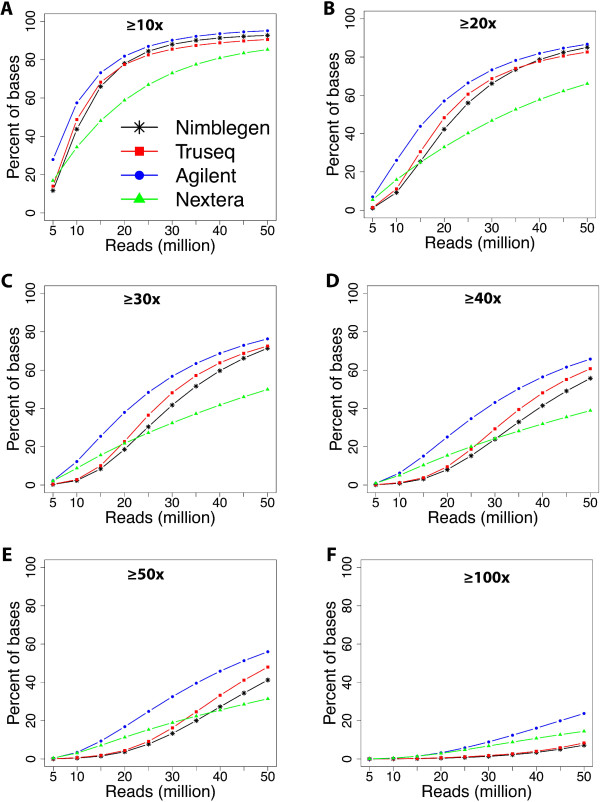
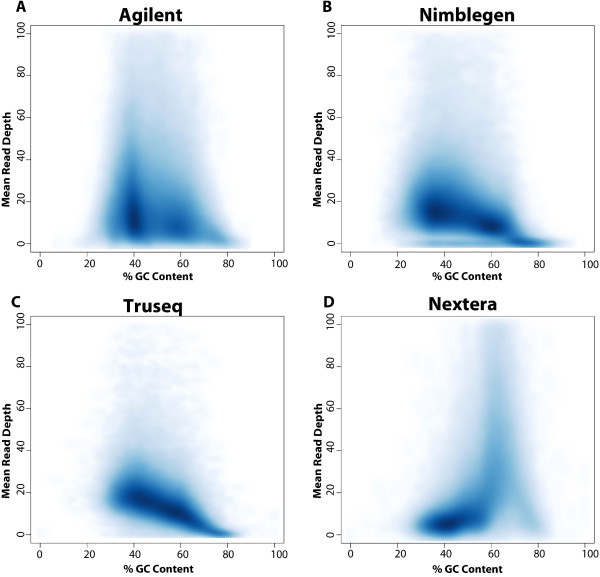
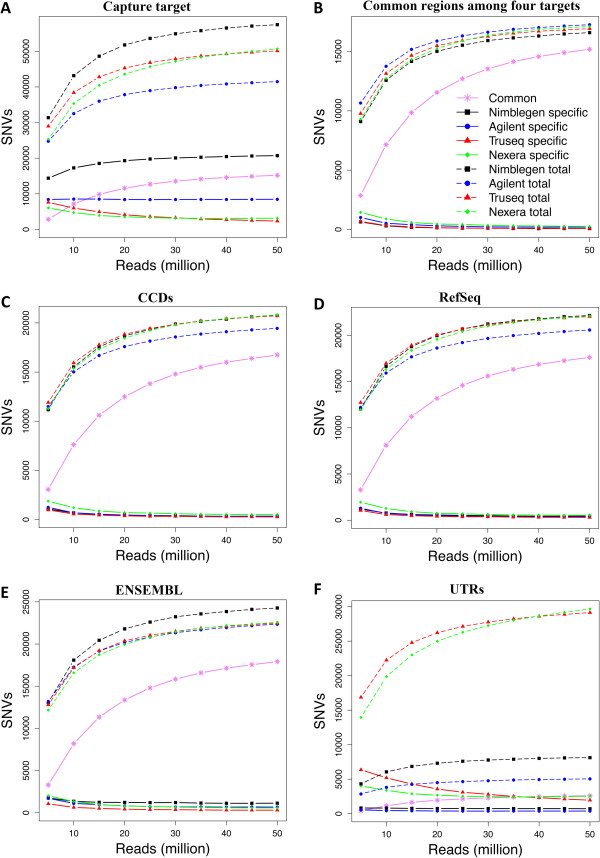
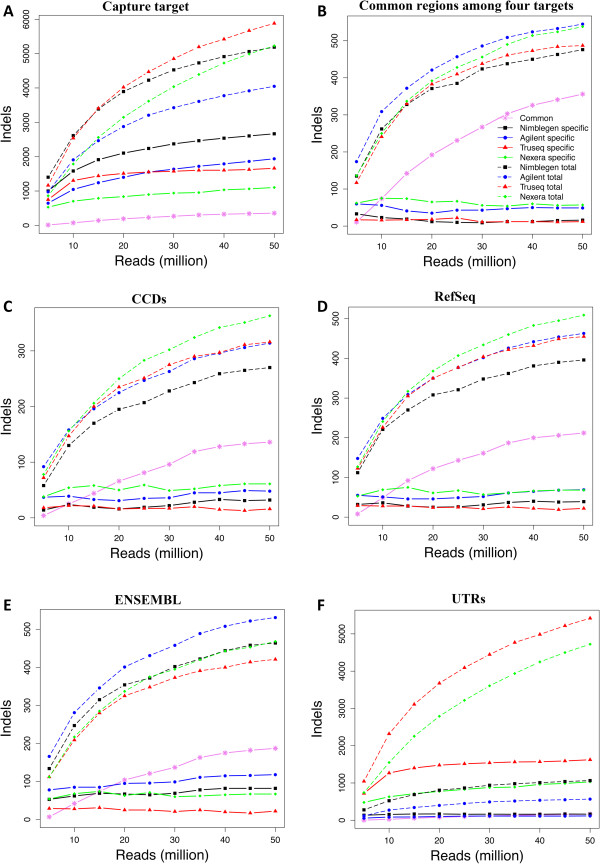
Results: Each capture technology was evaluated for its coverage of different exome databases, target coverage efficiency, GC bias, sensitivity in single nucleotide variant detection, sensitivity in small indel detection, and technical reproducibility. In general, all technologies performed well; however, our data demonstrated small, but consistent differences between the four capture technologies. Illumina technologies cover more bases in coding and untranslated regions. Furthermore, whereas most of the technologies provide reduced coverage in regions with low or high GC content, the Nextera technology tends to bias towards target regions with high GC content.
Conclusions: We show key differences in performance between the four technologies. Our data should help researchers who are planning exome sequencing to select appropriate exome capture technology for their particular application.
Figures
References
-
- Yu TW, Chahrour MH, Coulter ME, Jiralerspong S, Okamura-Ikeda K, Ataman B, Schmitz-Abe K, Harmin DA, Adli M, Malik AN, D'Gama AM, Lim ET, Sanders SJ, Mochida GH, Partlow JN, Sunu CM, Felie JM, Rodriguez J, Nasir RH, Ware J, Joseph RM, Hill RS, Kwan BY, Al-Saffar M, Mukaddes NM, Hashmi A, Balkhy S, Gascon GG, Hisama FM, LeClair E, et al. Using whole-exome sequencing to identify inherited causes of autism. Neuron. 2013;77:259–273. doi: 10.1016/j.neuron.2012.11.002. - DOI - PMC - PubMed
-
- Kalsoom UE, Klopocki E, Wasif N, Tariq M, Khan S, Hecht J, Krawitz P, Mundlos S, Ahmad W. Whole exome sequencing identified a novel zinc-finger gene ZNF141 associated with autosomal recessive postaxial polydactyly type A. J Med Genet. 2013;50:47–53. doi: 10.1136/jmedgenet-2012-101219. - DOI - PubMed
-
- Izumi R, Niihori T, Aoki Y, Suzuki N, Kato M, Warita H, Takahashi T, Tateyama M, Nagashima T, Funayama R, Abe K, Nakayama K, Aoki M, Matsubara Y. Exome sequencing identifies a novel TTN mutation in a family with hereditary myopathy with early respiratory failure. J Hum Genet. 2013;58:259–266. doi: 10.1038/jhg.2013.9. - DOI - PubMed
Publication types
MeSH terms
LinkOut - more resources
Full Text Sources
Other Literature Sources
Miscellaneous
